Trad-Fi Market Summary
The year-end rally seems to be setting up via liquidity, corporate buybacks, seasonals, January effect, Systematic Re-leveraging from the volatility market, and retail showing up. Year-end FOMO starting to kick in.
Overview of key macroeconomic events scheduled for the week ahead (This week is relatively light in terms of major economic data before we head into significant events like the FOMC meeting and options expiration.)
Monday:
Wholesale Inventories will be reported.
The Reserve Bank of Australia is set to announce its monetary policy decision.
Tuesday:
The Optimism Index and U.S. Productivity figures will be released.
Wednesday:
Key inflation data with the U.S. Consumer Price Index (CPI) is due.
MBA Mortgage Applications and changes in EIA Crude Oil and Gasoline Stocks will also be reported.
Thursday:
The U.S. Producer Price Index (PPI) will provide further insights into inflation.
Weekly Jobless Claims are expected.
Friday:
The Import Price Index will be released, providing information on import costs.
Liquidity Summary (Fed liquidity guide)
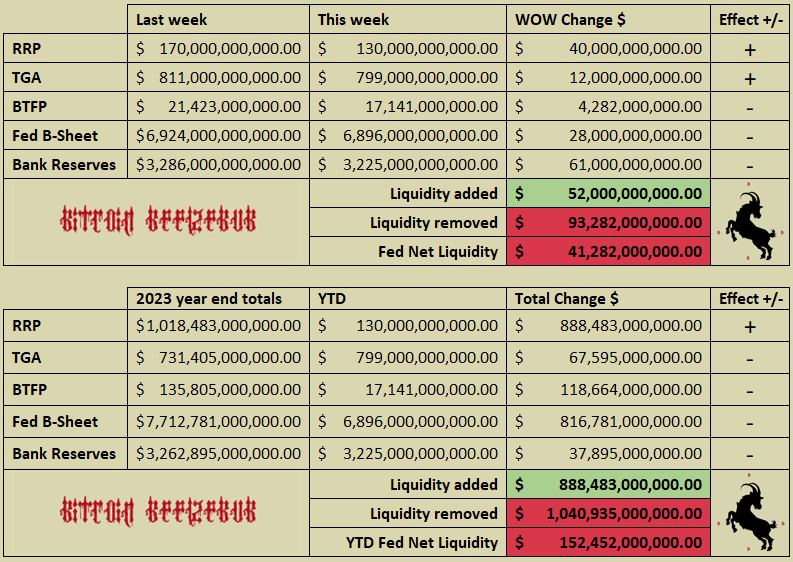
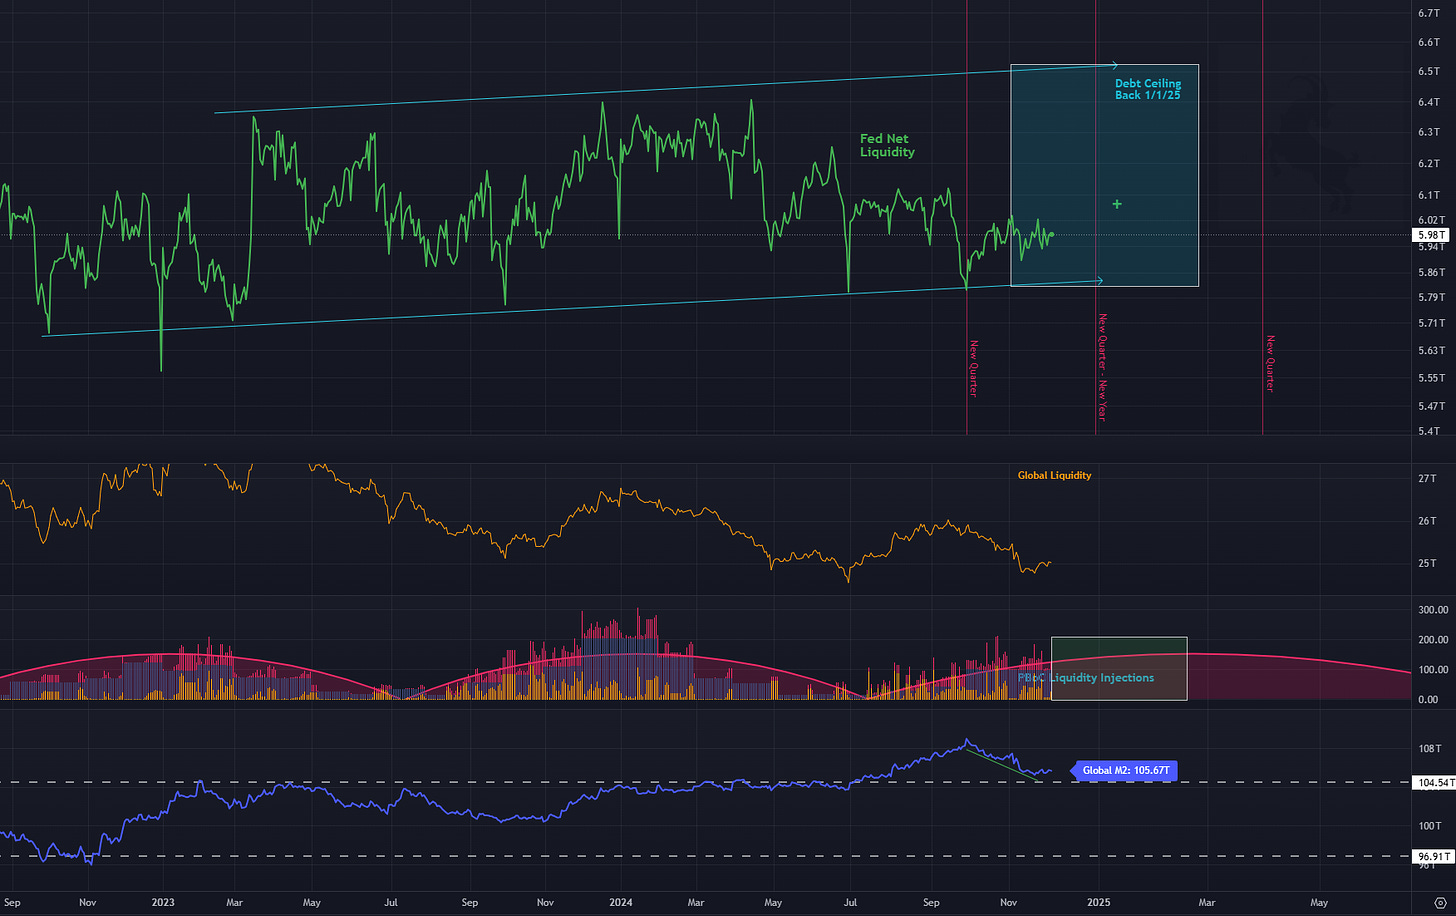
U.S. domestic liquidity net negative $41B, largely due to bank reserves over the last two weeks. (last week skipped so the data is a bit wonky) That said, RRP and TGA (main items in domestic liquidity flows) were positive and likely to continue until month, quarter, and year-end window dressing. Domestic liquidity remains range bound but a plethora of catalysts in many directions needing to be tracked. One coming in 2025 is the end in Fed quantitative tightening.
Global Liquidity appears to have found the floor after a rough Q4 open with PBoC liquidity injections showing life the last two days of the week. That said, 2025 remains a big question on direction as the dollar rally loses steam, the MOVE index cools off, term premia seem to have peaked and the mountain of debt maturing will be rolling over. All of that as inflation is likely to move up… (slow or fast is the question for the Trump Admin.)
The biggest risk on the horizon is the potential cascading effects of a Chinese economy that is in desperate need for stimulus the PBoC has been slow to provide and the clear warning from Chinese bonds. The 10-year Chinese government bond yield dropped below 2% for the first time on record, hitting a low of 1.9750% on December 2, 2024. This reflects a significant influx of capital into bonds as investors seek safety amid economic uncertainty and expectations of further monetary easing
Secured Overnight Financing Rate (SOFR):
This past week, the SOFR swaps showed nuanced changes. The short end of the SOFR swap curve saw gains of 3-7 basis points (bps), while the long end experienced a decrease of 2-3 bps. Alongside this, U.S. Treasury (UST) yields also saw a decline, with the 2-year yield dropping 2 bps to 4.15%, the 5-year yield by 11 bps to 4.05%, the 10-year by 11 bps to 4.17%, and the 30-year by 11 bps to 4.36%. This indicates a flattening of the yield curve.
Reverse Repo Market (RRP):
The RRP balance continues to make new lows and range between $130-$180B and all eyes are on the December FOMC meeting for clarity on the rate reductions that would likely lead to the draining of the RRP to zero. There will be a ton of unanswered questions on Trump 2.0-era policy changes from the Fed and Treasury before we know what to expect.
Treasury General Account (TGA):
The flood of Treasury issuance is cooling off heading into year-end - As the RRP depletes, the Fed’s tools for controlling short-term rates are less effective, leading to greater volatility in short-term interest rates. This shift will require the Treasury to adjust the mix and volume of debt issuance to keep rates stable and all eyes will be on the new admin for policy direction. Activist Treasury Issuance (ATI) might intensify as a means to influence monetary conditions directly and indirectly. Yellen and Biden will be handing the new Treasury Secretary a tough riddle to solve.
Increased Short-term Debt: A lower RRP balance might encourage the Treasury to issue more T-bills to absorb the liquidity moving out of the RRP, potentially manipulating the yield curve to keep longer-term rates lower. This has been discussed as a form of "stealth QE" where the Treasury's actions mimic some aspects of quantitative easing by influencing market liquidity and rates.
Impact on Long-term Rates: By flooding the market with short-term securities, the Treasury might aim to keep long-term rates lower, which could be seen as a counterbalance to Fed tightening. However, this strategy could also lead to higher volatility in interest rates if not managed carefully, as the market might react unpredictably to changes in supply and demand for securities.
Bank Flows (Defunct BTFP):
Bank reserves are down -$61.8B last 2 weeks and all eyes on bank cash as a % of assets, which continues to suggest that banks are moderately above their liquidity thresholds.
Big bank health appears in check as the BTFP continues to get paid down, closing in on fully paid off at $17B, down from $165B.
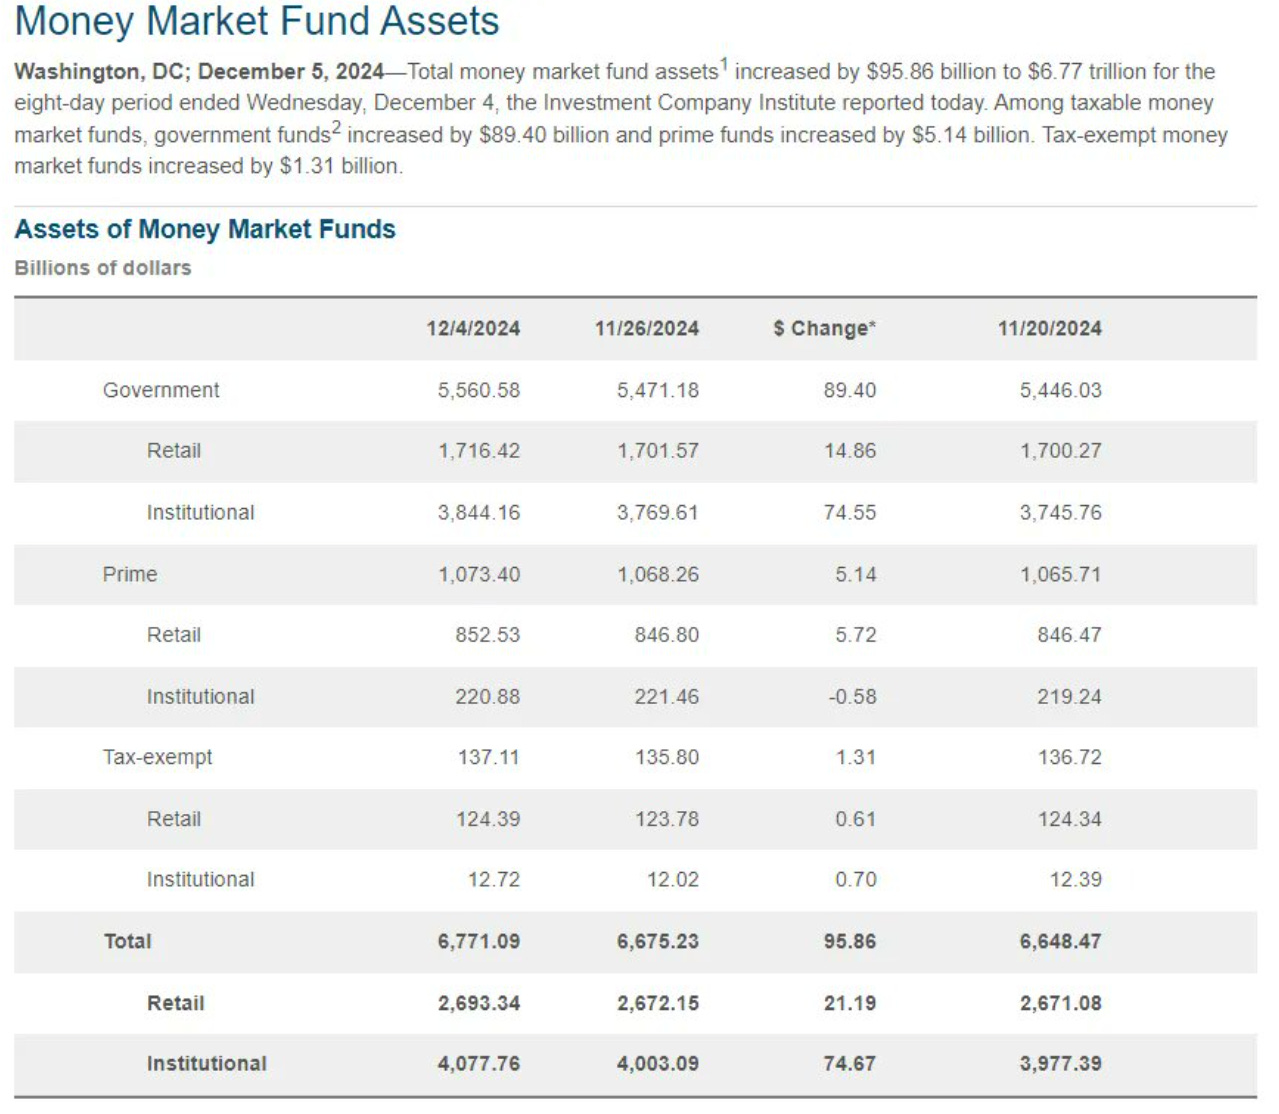
Money Market Funds (MMF) assets continue to rise after 2 weeks of outflows and we continue to look for a marker of outflow trends.
Fed Balance Sheet (QE/QT):
Based on Powell’s speech this past week, It is clear that we will get an end to the Fed balance sheet reduction in the first few months of 2025.
Federal Reserve & Co.
After two years of unprecedented monetary tightening, central banks executed a sharp pivot in 2024. Over the last three months alone, they've implemented 62 rate cuts, marking the highest number since the peak of the COVID-19 crisis in May 2020, bringing the annual total to 146. Bank of America anticipates an additional 124 rate reductions.
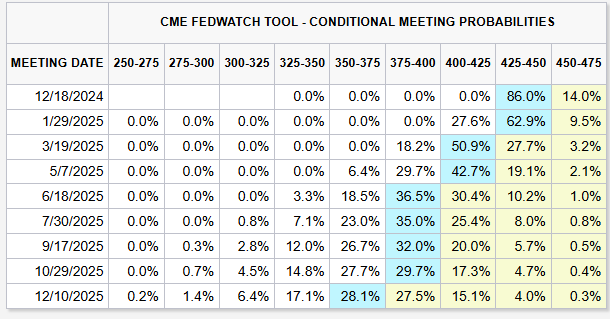
Based on Powell’s speech this past week, he seems committed to further policy reductions “trying to find R*” and that would extend to supportive Fed liquidity and monetary policy well into 2025. Despite the never-ending slue of Fed speaker’s hawkish views and honestly… lack of unity or understanding. The November payrolls report all but assured another 25bps rate cut by the Fed at the December 18 FOMC meeting.
I am sticking to a 25bps rate cut in December and future policy is a coin toss until the new regime is in place.
USD VS Everyone Else
Over the past week, the U.S. Dollar Index (DXY) has shown signs of slowing strength after a wild run-up after the first rate cut and continued after red sweep elections.
USD/CNY (U.S. Dollar vs. Chinese Yuan Renminbi):
The dollar strengthened against the Chinese Yuan last week, with the USD/CNY pair seeing the Yuan at a one-year low due to ongoing economic concerns in China and the potential impact of U.S.-China trade relations or tariff policies. The pair's exchange rate moved to reflect a rate where 1 CNY was approximately 0.1377 USD, indicating a slight depreciation of the Yuan
EUR/USD (Euro vs. U.S. Dollar):
The Euro weakened against the dollar, with the EUR/USD pair dropping by about 0.08% to settle around 1.0568. This decline might be linked to political uncertainty in Europe, particularly in France, which could undermine confidence in the Euro. Additionally, the expectation of a policy divergence between the ECB and the Fed might have played a role in this movement
USD/JPY (U.S. Dollar vs. Japanese Yen):
The USD/JPY pair saw the dollar gaining approximately 0.27% against the Yen. This movement comes amidst growing bets on a potential Bank of Japan (BoJ) interest rate hike, which could influence the Yen's value. Despite these expectations, the Yen has managed to perform relatively well, trading near six-week peaks, indicating some resilience or counter-trend in the pair's dynamics
Bitcoin Summary
Bitcoin breaks $100,000 U.S. dollars. Is the bull run over? No!
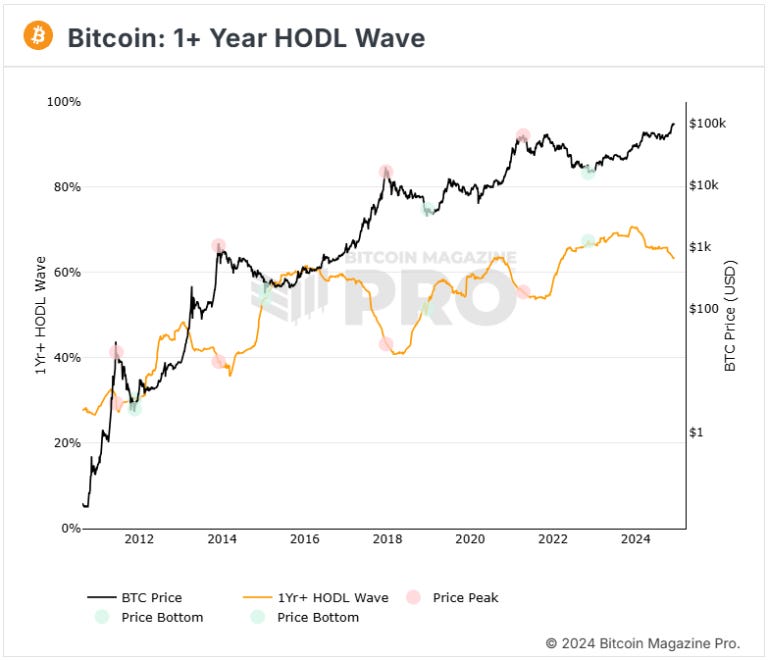
The current trend in the HODL wave suggests the bull market might continue as the percentage of coins moving on-chain hasn't yet reached the level of previous bull markets. The expectation is that this figure might exceed the 10% seen in the previous (2020-2021) bull market, which was considered "stunted" compared to the 2016-2018 cycle. This is certainly one of the more bearish points in the cycle but a top… I doubt it.
Institutions have net purchased 683,000 bitcoins year-to-date, primarily through U.S. spot ETFs and substantial acquisitions by MicroStrategy, a company known for its Bitcoin holdings. Next U.S. retirement funds, global sovereign wealth funds (SWFs), or a potential US strategic reserve fund.
Powell also mentioned Bitcoin as a digital gold in a recent presser and now the Treasury is following suit with this government narrative.
Bitcoin Daily
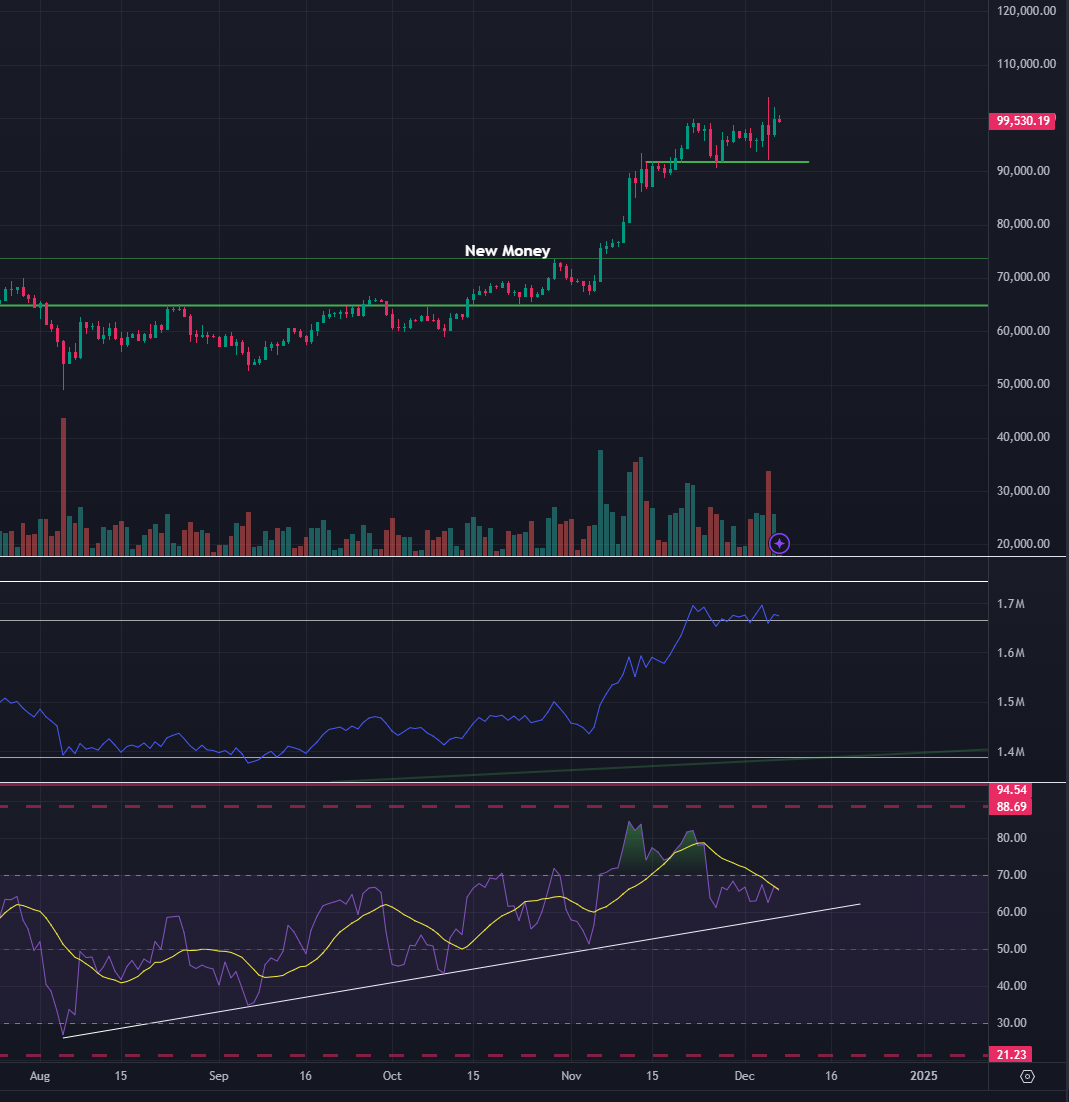
Not much changed big picture for Bitcoin price action last 2 weeks.. broke $100K Nov 22 and have been ranging since. The Darth Maul candle shook out some leverage in both directions and OI looks ready for another run.
Bitcoin LRC Chart
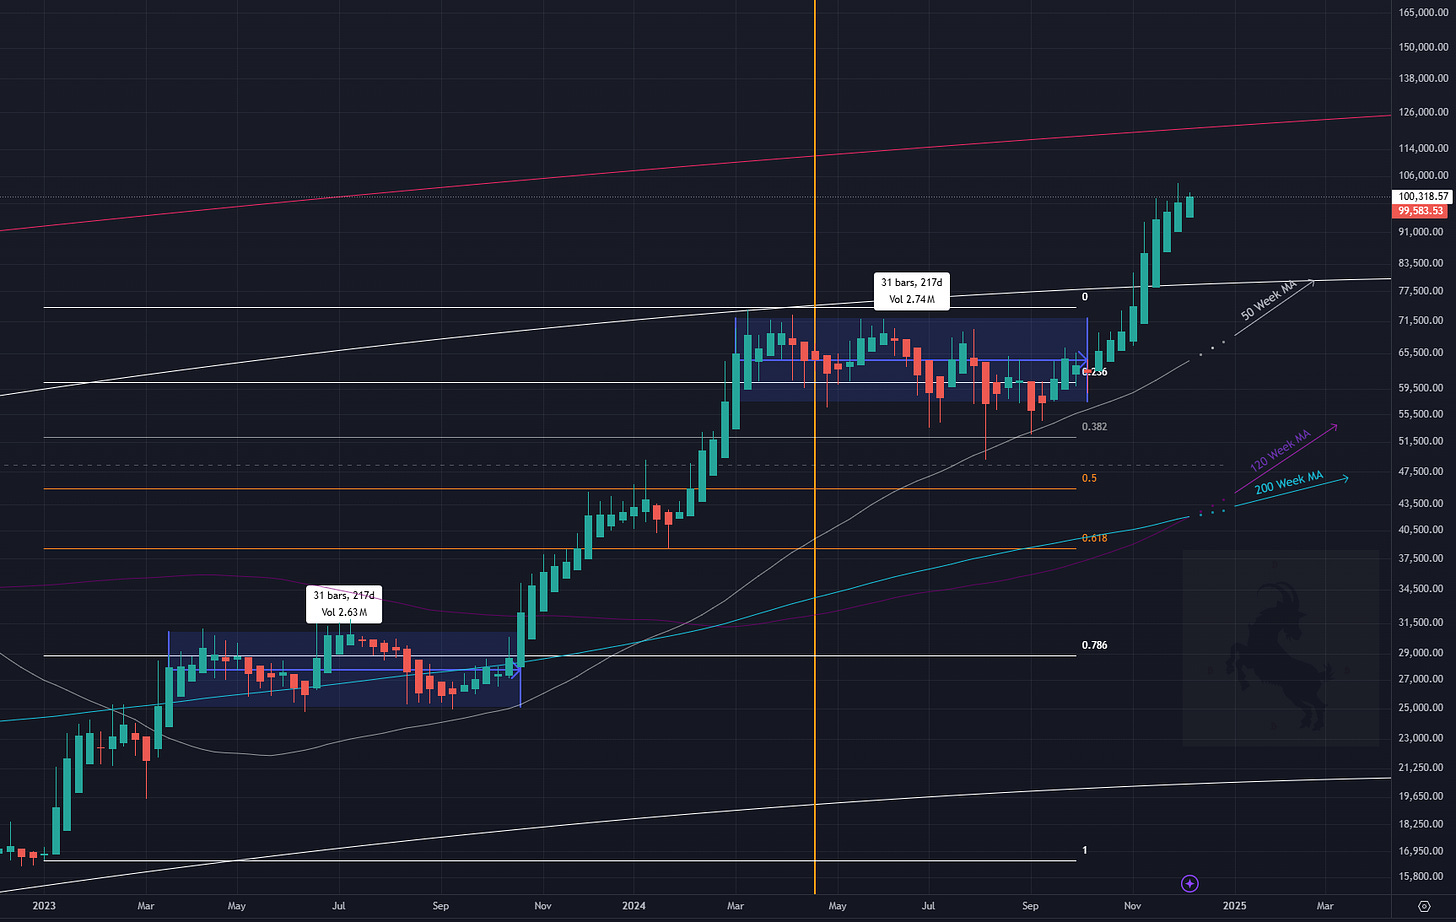
Again, nothing changed here - perfect breakout on time and price range now up 100% and 120K would be the target.


