


Ride The Wave, Bruh

Trad-Fi Market Summary
U.S. and Significant Global Events (Week of July 7, 2025)
MONDAY, JULY 7
U.S. Consumer Credit (May 2025)
Consensus Projection: Expected at ~$11.0 billion, indicating steady consumer borrowing.
Notes: Released at 3:00 PM EDT. Reflects consumer spending trends and debt levels, impacting retail and financial stocks. Higher borrowing could signal confidence but raise concerns about debt sustainability amid tariff pressures.China Caixin Services PMI (June 2025)
Consensus Projection: Expected at ~52.5, suggesting continued service sector expansion.
Notes: Released at 9:45 PM EDT (9:45 AM CST July 8). Influences CNY and Asian markets. Strong services growth may offset manufacturing weakness, though U.S.-China trade tensions remain a headwind.
TUESDAY, JULY 8
U.S. NFIB Small Business Optimism Index (June 2025)
Consensus Projection: Expected at ~90.5, reflecting cautious sentiment.
Notes: Released at 6:00 AM EDT. A key gauge of small business confidence, sensitive to tariff policies and inflation. A weaker reading could pressure small-cap stocks and signal broader economic concerns.Germany Industrial Production (May 2025)
Consensus Projection: Expected at ~0.3% MoM growth.
Notes: Released at 2:00 AM EDT (8:00 AM CET). Impacts EUR and European markets. Ongoing trade disruptions and energy costs could limit upside, affecting ECB policy expectations.
WEDNESDAY, JULY 9
Trump’s RoW reciprocal tariff pause would have ended but is now extended to August 1st…. or until it is extended again.
U.S. Wholesale Inventories (May 2025, Final)
Consensus Projection: Expected at ~0.2% MoM growth.
Notes: Released at 10:00 AM EDT. Provides insight into supply chain dynamics and demand. Higher inventories may signal slowing demand, impacting industrial and retail sectors, especially with tariff deadlines looming.Japan Household Spending (May 2025)
Consensus Projection: Expected at ~0.5% YoY growth.
Notes: Released at 7:30 PM EDT July 8 (8:30 AM JST July 9). Impacts JPY and domestic consumption outlook. Weak spending could pressure BOJ’s inflation targets and yen strength.
THURSDAY, JULY 10
U.S. CPI (June 2025)
Consensus Projection: Expected at ~3.1% YoY, core CPI at ~3.3% YoY.
Notes: Released at 8:30 AM EDT. A critical inflation gauge influencing Fed rate expectations and USD. Higher-than-expected inflation could reduce rate cut hopes, boosting bond yields and pressuring equities. Surprises to the downside would be the opposite. (Truflation showing 1.95%)China CPI (June 2025)
Consensus Projection: Expected at ~0.4% YoY, indicating subdued inflation.
Notes: Released at 9:30 PM EDT July 9 (9:30 AM CST July 10). Impacts CNY and commodity markets. Low inflation may prompt further stimulus, supporting Asian equities but raising deflation concerns.
FRIDAY, JULY 11
U.S. PPI (June 2025)
Consensus Projection: Expected at ~2.6% YoY.
Notes: Released at 8:30 AM EDT. Measures wholesale inflation, impacting corporate margins and Fed policy. A higher reading could signal persistent price pressures, affecting bond markets and USD. Surprises to the downside would be the opposite.
Recap of Last Week’s Data Results (June 30–July 4, 2025)
The proposed modifications to the Enhanced Supplementary Leverage Ratio (eSLR) standards for U.S. global systemically important banks (GSIBs) and their depository institution subsidiaries were approved by the Federal Reserve, with a 5-2 vote. The proposal is in the public comment phase until late August 2025, with no final rule adopted yet. The Federal Reserve, OCC, and FDIC are seeking input on the proposed changes and alternative approaches, such as excluding Treasury securities or central bank reserves from the SLR denominator.
U.S. Chicago PMI (June 2025)
Consensus Projection: Expected at ~44.5.
Result: Reported at 44.1, slightly below expectations, signaling persistent manufacturing contraction. Industrial stocks weakened, and USD saw mild pressure amid tariff concerns.U.S. ISM Manufacturing PMI (June 2025)
Consensus Projection: Expected at ~50.0.
Result: Reported at 49.8, indicating near-stagnation in manufacturing. USD and industrial equities dipped, with markets focusing on upcoming labor data.U.S. ADP Employment Report (June 2025)
Consensus Projection: Expected at ~160,000 jobs.
Result: Reported at 155,000, slightly below consensus, reflecting steady but unspectacular hiring. USD remained stable, with focus shifting to Nonfarm Payrolls expectations.U.S. Initial Jobless Claims (Week Ending June 28, 2025)
Consensus Projection: Expected at ~215,000.
Result: Reported at 212,000, slightly better than expected, supporting labor market resilience. USD and equities saw modest gains before early market closure on July 3.Eurozone CPI (Flash Estimate, June 2025)
Consensus Projection: Expected at ~2.3% YoY.
Result: Reported at 2.4%, slightly above ECB’s 2% target, driven by energy costs. EUR strengthened modestly, but ECB rate cut expectations remained intact.Global Equity Markets (Week Ending July 4, 2025)
Result: S&P 500 and Nasdaq held near record highs, supported by optimism over U.S.-China trade talks, despite early market closure on July 3. Defensive sectors outperformed amid Middle East tensions and tariff uncertainties. Dow Jones lagged due to industrial exposure.

Liquidity Summary (Fed liquidity guide)
Fed net liquidity was negative $87B even after reversing $300B in window dressing. Bank reserves down WoW last few weeks and going to continue with the pending TGA refill.
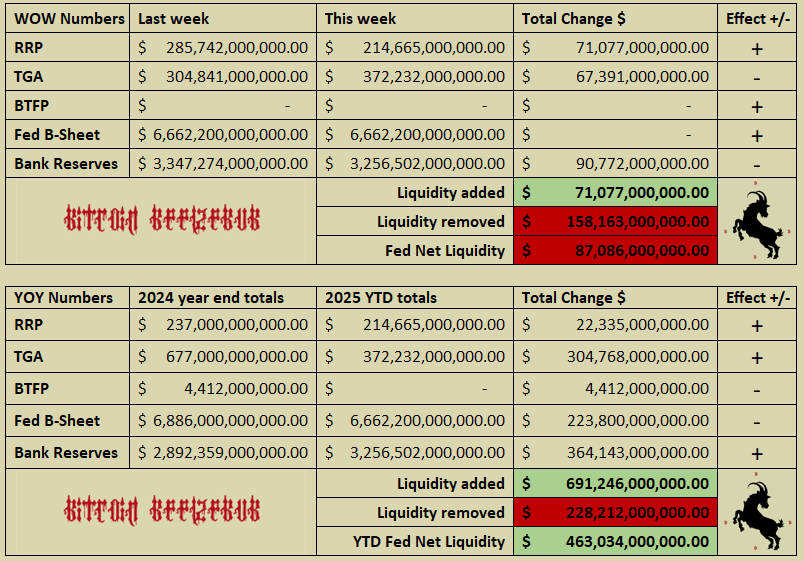
Reverse Repo Market (RRP):
The RRP, currently at $214 billion, is expected to play a significant role in supporting the TGA replenishment through interbank reserve lending and borrowing markets, potentially dropping to around $50 billion if successful. If unsuccessful, the RRP could remain elevated, and the Standing Repo Facility might grow substantially.
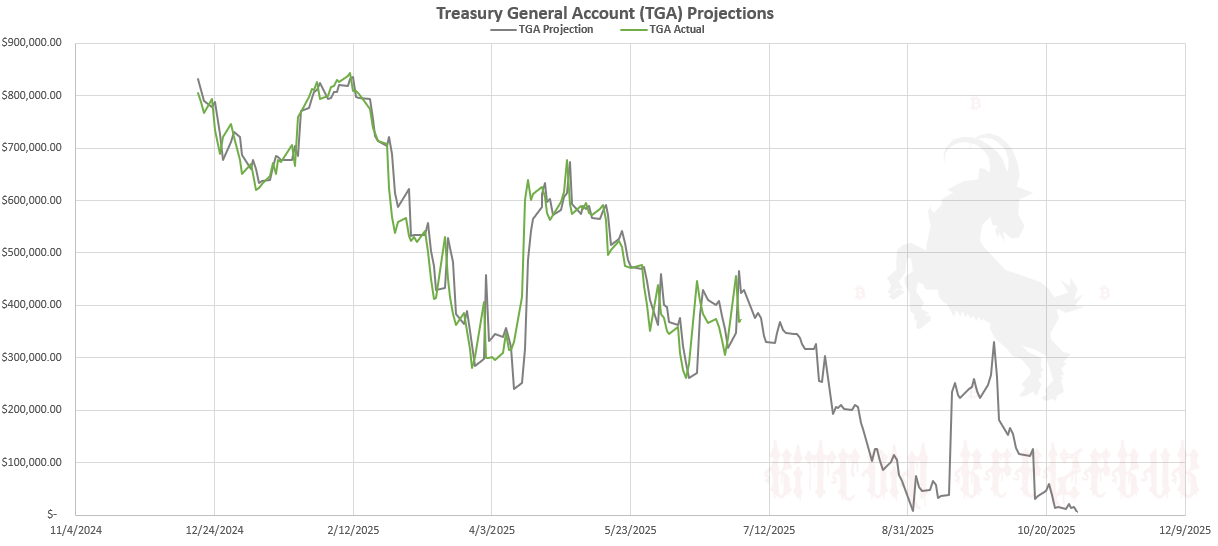
Treasury General Account (TGA):
As the TGA rundown concludes with the OBBB's passage, raising the debt ceiling by $5 trillion, the timeline for refilling the TGA from its current $372 billion level begins. I’m sharing the Macro Timeline Update chart to highlight the precision of this critical domestic liquidity driver and give a shoutout to John Comiskey’s excellent newsletter, which has informed my liquidity projections and understanding of Treasury mechanics. (Updates on the change to TGA flows released yesterday)
With the passage of the OBBB, the Treasury General Account (TGA) is slated to be replenished to $850 billion (subject to adjustments in the July Quarterly Refunding Announcement), necessitating approximately $483 billion in new Treasury bill issuance. Given the current $214 billion in overnight reverse repurchase agreements (ON RRP), the open market will need to absorb an additional $269 billion ($483 billion - $214 billion) in bills, which appears feasible. While various complexities may arise in the coming weeks, this replenishment process is likely to exert a net negative impact on domestic liquidity until the TGA is fully restored. However, 1-month bills are now trading above ON RRP rates, a shift likely driven by the recent tax bill approval and a robust Nonfarm Payroll (NFP) report, indicating a market response to heightened liquidity or tax-related cash inflows. (Base case is that this event will be manageable and not cause a 2019-era liquidity crisis)
Based on the latest data from the Federal Reserve (as of July 2, 2025) and the pending TGA refill through the remainder of July, bank reserves are expected to decline by over $270 billion relatively quickly. This follows a downward trend observed over the past two weeks. The H.4.1 report shows reserve balances with Federal Reserve Banks at $3,255,980 billion (or $3.26 trillion) for the week ending July 2, down $143,348 billion from the prior week. With the anticipated reserve drop, levels are projected to fall below the $3 trillion mark, which represents approximately 10% of U.S. GDP and is considered a key constraint level. All eyes will be on this threshold as the TGA refill progresses.
Fed Balance Sheet (QE/QT):
The Fed's QT balance sheet runoff is progressing steadily at the reduced pace, with the balance sheet at $6.76 trillion. Obviously, the reduction in pace was in preparation for approaching TGA, and the Fed feels well-positioned for any liquidity strains. In a stressed scenario, the SRF could grow substantially to provide liquidity to banks facing reserve shortages, potentially reaching levels seen during past market stress events (e.g., 2019 repo market turmoil). This would indicate significant liquidity strains and could prompt the Fed to pause or end QT to avoid market disruptions. (Not my base case here)
For a complete view of global liquidity, projections, and how we are positioning, see the Macro Timeline Update and join the chat for premium members.
Federal Reserve & Co.
Based on the CME FedWatch Tool's conditional meeting probabilities as of July 06, 2025, the market anticipates a cautious Federal Reserve stance on interest rate adjustments. The data shows a low probability of a rate cut at the July 30, 2025 meeting (4.7% chance for a 400-425 basis point cut, 95.3% for 425-450), suggesting stability in the current 4.25%-4.5% range. For September 17, 2025, the probability of a cut rises slightly (3.2% for 275-300, 66.2% for 300-325), indicating a modest expectation of easing.
Dovish Fed speakers, like Governor Christopher Waller, Michelle Bowman, and Austan Goolsbee, have made the case for a July cut, cautioning against waiting for labor market deterioration and tariff inflation that has not yet materialized, advocating preemptive action.
Mr. Powell himself: On June 18, 2025, he noted that inflation is “coming down” and highlighted AI as a potential deflationary factor, suggesting conditions could support future rate cuts. On June 24–25, 2025, during congressional testimony, he said, “We could see inflation come in not as strong as expected, if that’s the case, we would suggest cutting sooner,” and indicated that tariffs might cause only a one-time price increase, implying openness to cuts if inflation data weakens.
Regardless of July or September, cuts are coming back, and rates will be MUCH lower by mid-2026. (and inflation will be MUCH higher…)

USD VS Everyone Else
Dollar Index (DXY): DXY closed at 96.9910 on July 4, 2025, down 0.27% from 97.254 the prior week, extending its fifth consecutive weekly decline and eighth straight monthly drop. The DXY fell to a 3.5-year low, briefly breaching 97.0, driven by optimism over U.S. trade negotiations, expectations of Federal Reserve rate cuts, and investor shifts toward higher-yielding assets in Europe and Japan.
U.S. Economic Data: June’s employment report, released July 3, showed 147,000 jobs added, slightly below the 150,000 expected but up from a revised 142,000 in May. The unemployment rate unexpectedly dropped to 4.1%, below the Fed’s 4.4% Q3 projection, with wage growth at 0.4% month-on-month, topping forecasts. Core PCE data on June 28 aligned with expectations at 0.2% month-on-month and 2.6% year-on-year. Personal income rose 0.3%, meeting estimates, but real consumption fell 0.2%. The Atlanta Fed’s GDPNow Q2 estimate was trimmed to 2.7% from 2.9%. Money markets now price 45bps of Fed rate cuts for 2025, with an 80% chance of a cut by September.
U.S. Trade: The June Advance International Trade in Goods report indicated a U.S. trade deficit of $81.2 billion, down $1.5 billion from May’s $82.7 billion, driven by a $3.1 billion drop in imports to $270.0 billion. The narrowing deficit, tied to stabilizing import flows post-Trump’s April tariffs, supports Q2 GDP estimates. The persistent trade deficit, at 4.2% of GDP, remains a long-term concern for Dollar strength.
Trump announced the second trade deal with Vietnam, advising a 20% tariff + 40% tariffs for freight transshipping from China. He also mentioned that there is unlikely to be a trade deal with Japan, and their tariffs will be around 25%.. The rest of the world tariff pause comes to an end on July 9th, and the President announced that "10 or 12" letters will be sent to trading partners on Friday, July 5, with more to follow in the coming days. These letters will outline unilateral tariffs effective August 1, ranging from 10% to 70%, surpassing the upper limits of earlier Liberation Day announcements. U.S. Treasury Secretary Scott Bessent advised that the letters going out will confirm April 2nd tariff levels enforced if no trade deal is reached, and those tariffs will be applied on August 1. (which feels like another extension…..)
South Korea’s Push: South Korea is actively seeking an extension, with Trade Minister Yeo Han-koo proposing manufacturing partnerships and tariff reductions on automobiles and steel during talks with U.S. Trade Representative Jamieson Greer.
Ongoing Negotiations: Countries like India, Japan, and the EU are still set to finalize trade deals before the new deadline. India’s trade team extended its stay in Washington, and the EU is exploring a provisional deal to reduce a potential 50% tariff to 10%. However, Bessent admitted that “100 smaller countries will get a set tariff rate, as many never even contacted us.”
Mixed Signals: While Trump previously indicated no extension, multiple WH officials stated that “big trade deals coming over the coming days” multiple times each month after 4/2, and recent statements from the White House suggest flexibility for countries negotiating in good faith, with decisions resting with the President.
CNY/USD: The Yuan held steady, with USD/CNY at 7.1640, down 0.04% week-on-week. China’s July PMI climbed to 51.5, signaling robust expansion, but export growth slowed amid U.S. sanctions. The PBOC reiterated Yuan stability measures, with Q3 guidance emphasizing tighter offshore Yuan liquidity controls.
JPY/USD: The Yen strengthened, with USD/JPY closing at 144.44, down 0.24% from 144.80. Japan’s June retail sales grew 0.6% month-on-month, and strong household spending data raised speculation of a BoJ rate hike, supporting JPY. Support lies at 144.00, with resistance at 145.50. 30-year JGB yields rose 80bps year-to-date.
EUR/USD: The Euro edged up, with EUR/USD at 1.1760, up 0.34% from 1.1720. Gains were driven by German industrial data and EU-U.S. trade optimism, though ECB signals of a July 25bps rate cut tempered upside. Eurozone June inflation eased to 2.4%, below the 2.5% expected. Support is at 1.1700, resistance at 1.1850. A DXY rebound above 97.5 could weigh on EUR/USD.
Emerging Markets (EMFX): EM currencies were mixed. The Mexican Peso (MXN) and Indonesian Rupiah (IDR) gained on Asian demand and trade talk hopes, while the Brazilian Real (BRL) softened amid fiscal concerns. The Turkish Lira (TRY) weakened further due to 50%+ inflation pressures. The South African Rand (ZAR) rose 0.3%, supported by commodity price stability. India’s prior 50bps rate cut to 5.50% continued to bolster EMFX sentiment, though Canada’s tariff threat sparked late-week caution. ING analysts see Asian EMFX resilience but warn of volatility from U.S. policy shifts.
Bitcoin Summary
Talk of the town (CT) has been Satoshi-era wallets waking up, sparking a lot of FUD around a potential 90,000 coins hitting the markets with an OG market selling $9.74 billion USD… 1) that is not how whales sell and 2) Daily Bitcoin spot volume trades around $6B, and futures volumes trades around $80B so the market for Bitcoin is a lot bigger than most give it credit for…
Last week, U.S.-based spot Bitcoin Exchange-Traded Funds (ETFs) experienced a significant slowdown in activity, with a notable shift from the robust inflows seen in prior weeks. Despite the outflows, earlier in the week, Bitcoin ETFs had continued their positive run. Data for the week ending June 27 saw $2.2 billion in inflows, with BlackRock’s iShares Bitcoin Trust (IBIT) alone purchasing 1,530 BTC worth $163.7 million on June 26, contributing to over $1.15 billion in inflows for the week.
Institutional buying activity also reflected a more complex picture. While earlier weeks saw aggressive accumulation—BlackRock’s IBIT bought 11,638 BTC in the week ending June 27, outpacing the average 3,150 BTC mined weekly—recent data suggests a pullback. K33 Research reported that annualized BTC CME futures premiums dropped to an 8-day low of 6.5% on June 30, indicating a “sustained reluctance” among institutional traders to take new long positions. Additionally, on-chain metrics from Glassnode showed a 0.3% week-over-week decline in Bitcoin wallet addresses holding over 1 BTC as of July 7, suggesting some profit-taking or reallocation
Bitcoin Daily
Bitcoin had another failed attempt at making new NEW all-time highs and is currently consolidating above the prior ATH. However, the odds of making a new high are extremely high as buying pressure outpaces selling pressure and the bearish case has no legs to push price down under 100K for longer than a daily candle.
There will be volatility around the TGA refill negative liquidity narrative but the long-term macro picture is quite bullish here.

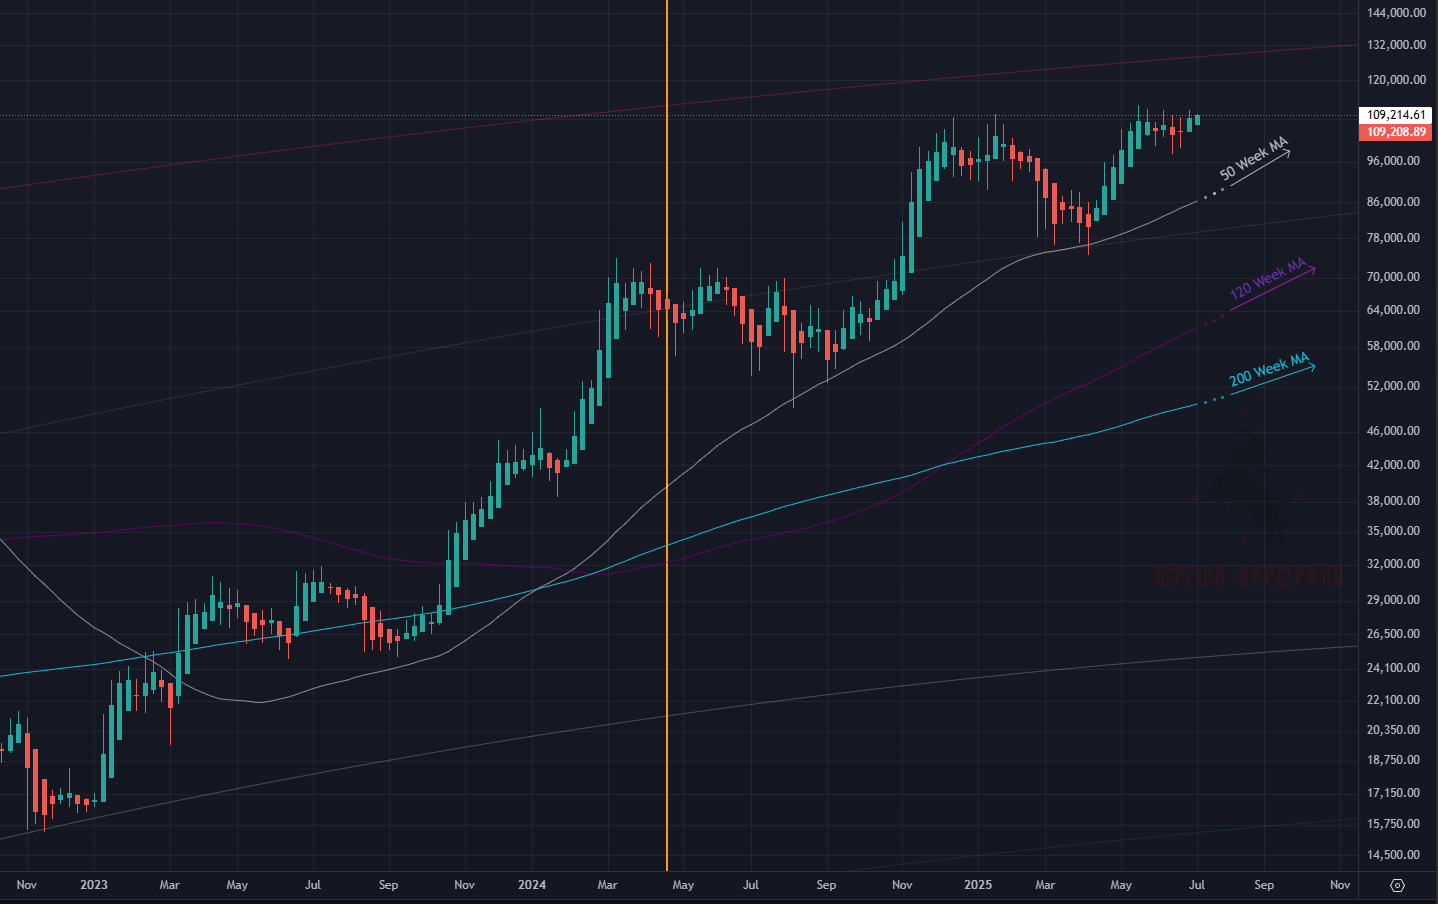
Bitcoin LRC Chart
The weekly Bitcoin candle opening green for the second week in a row suggests ongoing bullish momentum. Over the past three-year bull run, corrections featuring more than two red candles followed by two green ones have often preceded significant price surges, a pattern that may be emerging now.
With the current price around $108,000 and a green open, there’s a stronger case for continued buyer enthusiasm. The 50-week MA providing dynamic support, alongside the price remaining above the 200-week MA, points to a sustained long-term uptrend. This second green candle could reflect growing confidence, potentially driving the price toward the $120,000–$130,000 resistance level, as suggested by the Triple MA forecast close, Fibonacci 1.618 extension, cup & handle target, etc. etc. etc.
Excellent information. Complete & concise. Thanks as always.