


Reacceleration Warp Speed

Trad-Fi Market Summary
This week, the financial markets experienced fluctuations as stocks and bonds encountered a choppy environment. The Dollar's upward momentum was disrupted by a softer ISM services PMI, which impacted the US 10-year yield, pushing it higher without closing in this area since late November.
Notably, equities and rates have moved in tandem recently, raising the question of whether the S&P 500 will print a new low as rates continue their upward trajectory. The short-term gap between the VIX and the S&P 500 is also widening, indicating increased market stress.
As outlined a few weeks ago, energy stocks are now breaking out, yet the market’s allocation remains light, which is beneficial for trades but may also indicate a reacceleration of inflation. The reason a 3% inflation target is so attractive is that the 40% new money supply added in the last 2 years, permanently expanded money circulating and diffusing itself throughout the economy over time, elevating prices along the way.
As we approach the end of April, corporate activity is expected to increase when the blackout window closes on April 26th. Companies are showing a strong appetite for buybacks, with authorizations tracking closely to the record levels seen in 2022. This year, executions are already in the $300 billion range, surpassing last year's figures.
Meanwhile, money market funds remain on the sidelines, with total global assets exceeding $9 trillion. This suggests that there is a significant amount of cash reserves waiting to be deployed. Additionally, households are sitting on $3.2 trillion in dry powder, indicating that investors are getting anxious to put their cash to work.
This buildup of cash reserves and the potential decline in cash yield in the coming months, as forecasted by Goldman Sachs, may be directly correlated. As a result, we could see increased activity in the financial markets as investors look for opportunities to deploy their cash and earn higher returns.
This week we have some big events to watch and 8 Fed speakers to comment on the fresh new data.
March CPI Inflation data - Wednesday
Fed Meeting Minutes - Wednesday
March PPI Inflation & Initial Jobless Claims data - Thursday
U-Mich Consumer Sentiment data - Friday
REACCELERATION!!!!

Liquidity
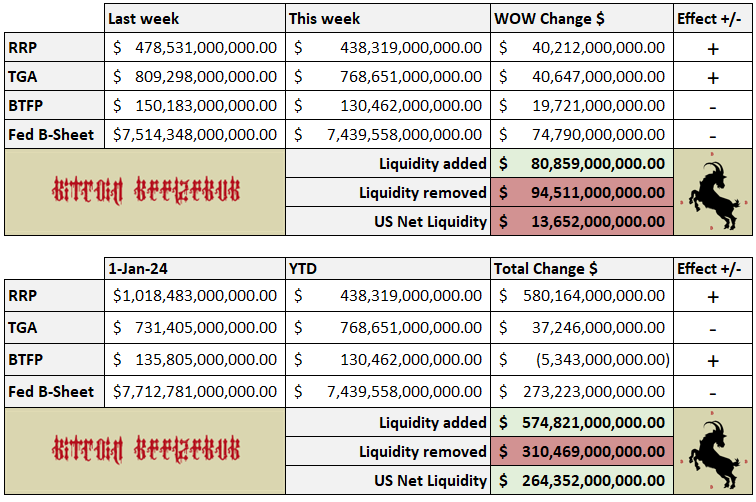
U.S. Domestic Net Liquidity Negative $13B
Global liquidity continues to be rangebound with a slight downward pressure for seasonality via tax season volatility. (overall liquidity data tends to get messy around tax season up to the end of April)
M2 money supply experienced a minor decline yet is still in trend.
Overall liquidity remains rangebound - my base case has been a slowdown March-May waiting for the next expansion of liquidity that is likely to occur in Q2/3 but signals are not there yet.
P.S. SPX/MOVE converging = bad for liquidity. Eyes on this and why I keep posting the MOVE, SPY, SOFR, And liquidity factors on my twitter/X.
Secured Overnight Financing Rate (SOFR):
Over the last two weeks, the Secured Overnight Financing Rate (SOFR) has experienced slight fluctuations. Specifically, the SOFR rate was 5.32% on April 4, 2024, and this rate was based on approximately $2.0T of repo transactions, where 98% of them used rates between 5.28% and 5.41%. The SOFR rate remained steady at 5.32% as of the time of writing. This data indicates that there have been minor changes in the SOFR rate over the last two weeks, with the rate varying within a narrow range of 5.32% to 5.34% during this period.
The March quarter-end activity prompted SOFR volumes to rise over $2T for the first time ever.. LIBOR transition is officially over.
Reverse Repo Market (RRP):
Over the last two weeks, the Fed reverse repo market activity has shown a slight decrease in the total amount of reverse repurchase agreements. The RRP has seen some violent erratic swings from $400B to $590B landing back down to the current level. I still assume the drain will continue after tax season.
Treasury General Account (TGA):
Over the last two weeks, the TGA has also seen violent and erratic fluctuations in balance since the start of 2024. Specifically, the TGA balance bounced between a low of $750B (Jan 3) to a high of $840B (Jan 31) and is now back down to $768B. (as of writing) April is always a risk due to the potentially large incoming tax payments to TGA (if the economy aka GDP is actually as strong as they say) so another reason why I was looking at March as a top and pending indicators for the weakness to be a buying opportunity.
We also saw the first $200M treasury buyback via the long end.
Bank Flows (Defunct BTFP):
Money-market fund total assets jumped over $70BN last week to a new record high above $6.11TN. Total bank deposits exploded higher by $77BN (the fifth straight weekly increase in deposits), back to pre-SVB levels. (Large banks +$69BN, Small banks +$12BN) Bank reserves at The Federal Reserve are falling significantly and diverging from US equity market cap. Not to mention the $100B they “misplaced”…
Regardless of FDIC confidence, small banks continue to feel the pain VS big banks and that is confirmed via the regional bank index is down 13% while larger banks push 3% and all bank reserves pump…

This week most expected a pop in Federal Reserve discount window activity due to BTFP ending but the loan balance was reported to be $5.45B for the week of April 3, which is a decrease from $6.27B in the previous week. This supports the thesis that financial stress among banks is down. However, despite encouragement from the Fed for institutions to be prepared to access discount window loans, the weekly Fed report on discount window borrowing risks "outing" banks that use this facility, which could lead to negative market sentiment for the stock and reputational damage. This stigma has been a topic of concern for the Federal Reserve and could potentially discourage banks from using the discount window even in times of need.
Fed Balance Sheet (QE/QT):
Over the last two weeks, the Federal Reserve's balance sheet has seen additional slowing in reduction speed with data via their H.4.1 statistical release. The Fed's balance sheet is now at its lowest level since February 2021, down $1.5T from its peak in April 2022 but $3.3T more is needed to unwind Covid QE…
Federal Reserve & Co.
2 weeks ago I wrote the Fed speakers would try to counter Powell’s dovish rhetoric and that is exactly what we got but with an even crazier twist.
We got a wild ride of mixed signals from Fed voting members - one could even argue they are completely not seeing eye to eye or are purposely trying to give mixed signals.
- Jerome Powell (Chair): Uber dove Inflation dead victory lap, 3 cuts in 2024.
- Lael Brainard: Likely 2 rate cuts end of year data depended
- Philip N. Bostic: Sees 1 rate cut 4th quarter
- Lisa D. Cook: No rush to cut rates any time soon
- Philip N. Jefferson: No rush to cut rates any time soon
- Michael S. Barr: Need inflation closer to 2% for rate cuts
- Neel Kashkari: No cuts this year (not a voting member and a clown)
- Michelle W. Bowman: possible Fed might have to hike again….
The market's anticipation of an initial 0.25 percentage point interest rate decrease by the Federal Reserve in June is diminishing as recent U.S. data indicates a robust economy with limited potential for easing monetary policy. On FedWatch, the likelihood of a May cut is less than 5% and a June cut has decreased to 50%, while the probability of maintaining the current 5.25%-5.5% range has increased to 46% from 30%. For July, the odds of maintaining the current rate have also risen to 50% from 16%.
Meanwhile, banks see the June rate cuts situation in rose-colored glasses.
This week, ADP reported that U.S. employers added 184,000 jobs in March, surpassing expectations. Further labor data is expected later this week, and the Consumer Price Index (CPI) numbers will be released on April 10. Behind the seemingly positive jobs data, a closer look reveals a significant increase in part-time jobs and non-citizen workers, which may be skewing the data. The market sees it as positive but We are seeing the biggest fall in full-time workers, the biggest rise in unemployed workers, and the biggest increase in part-time workers (relative to full-time) in history… without a recession. Also worth noting all three payroll reports for this year have shown job growth exceeding the highest estimate on Wall Street, which is statistically improbable. You don’t need a tinfoil hat to be suspicious of the data but we know it will be used by Powell at face value.
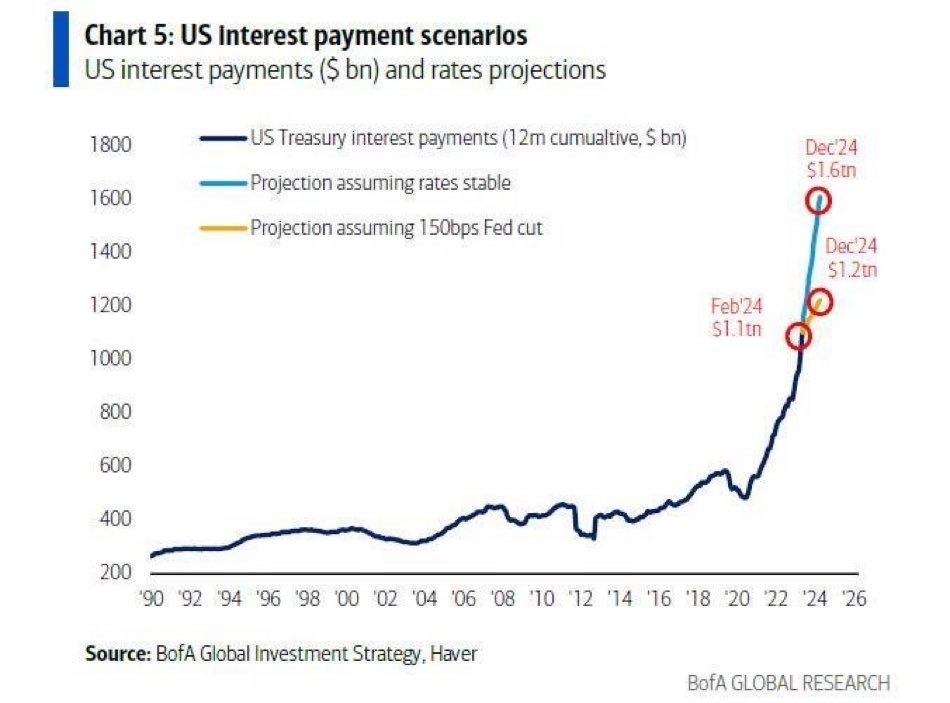
Worth noting the Fed admits an operating loss of $114B in 2023 and if the Federal Reserve maintains its current interest rates, the federal interest expense is projected to escalate by $500 billion over the course of the year. Conversely, if the Fed decides to cut rates by 1.5%, the interest expense will increase by a more modest $100 billion. However, opting for a rate cut could heighten the risk of a resurgence in oil prices.
USD VS Everyone Else
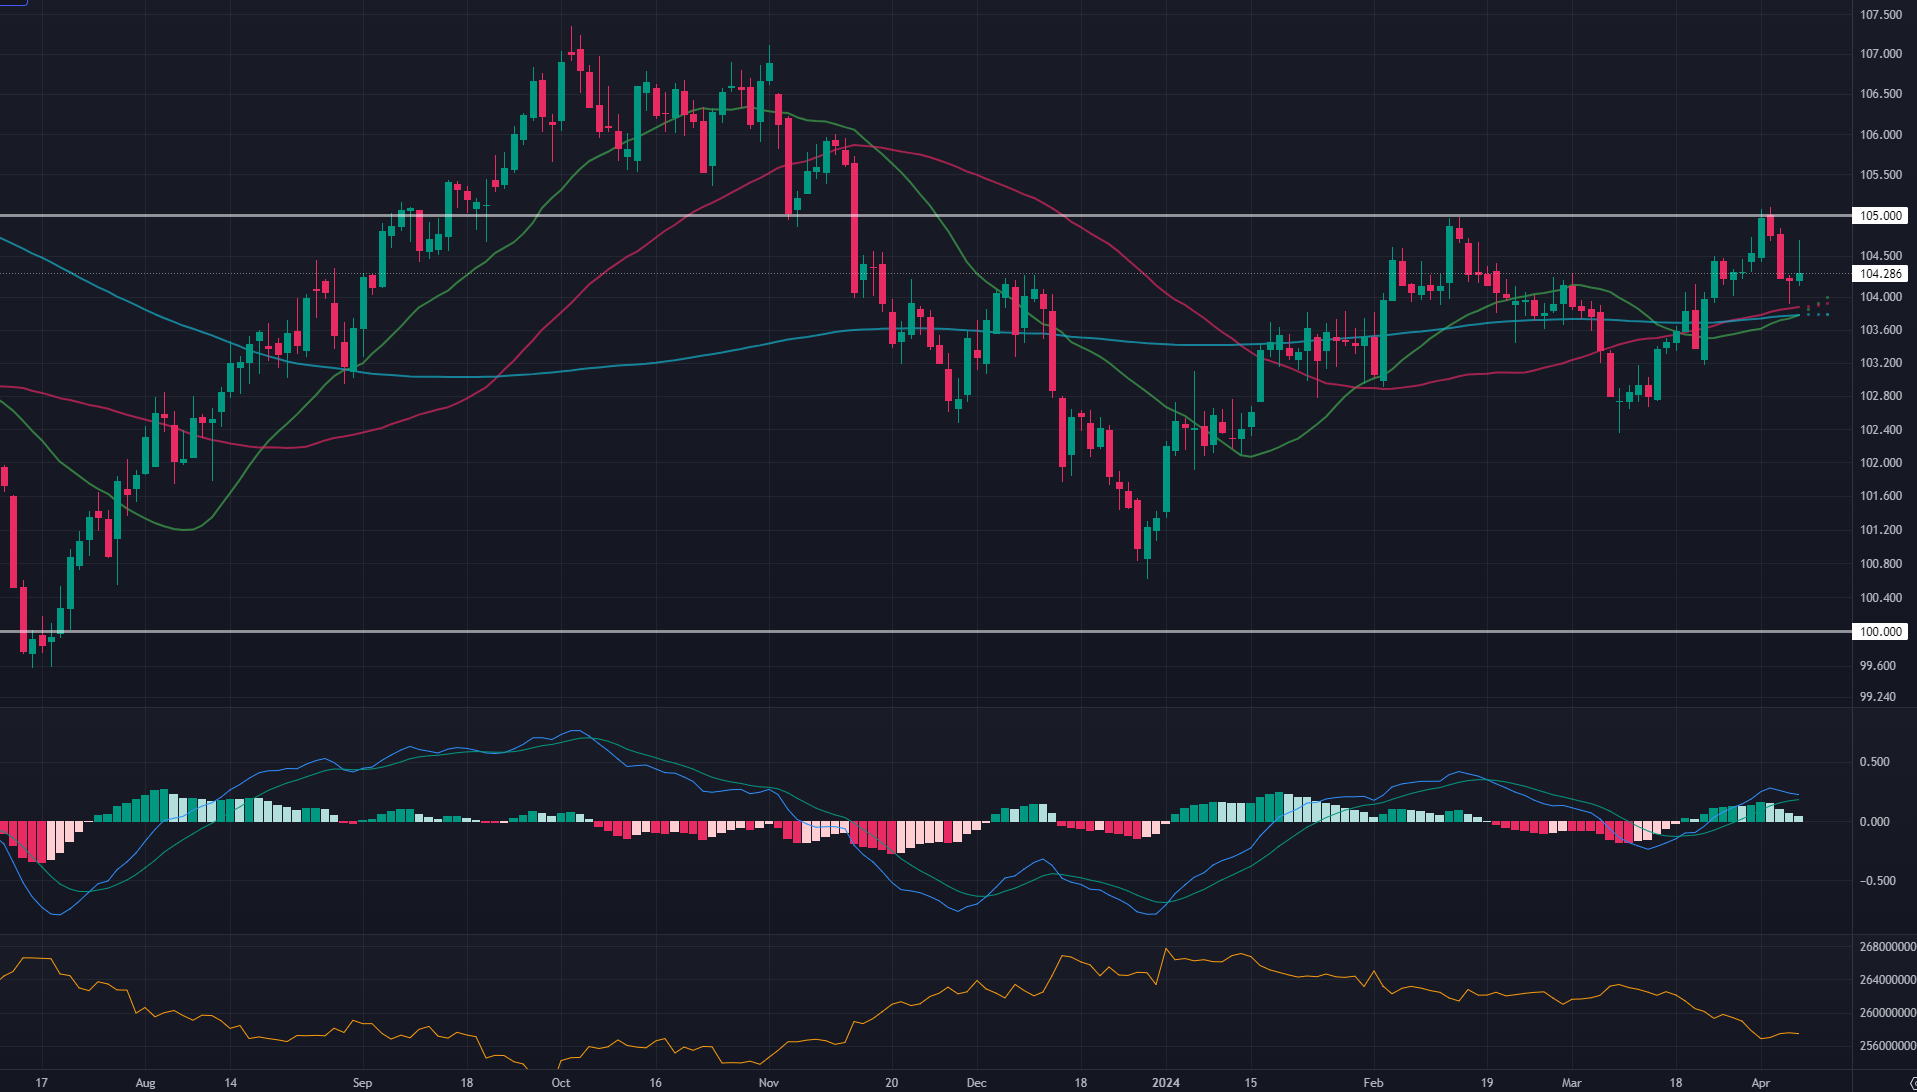
The U.S. dollar index has been bouncing between 100 and 105 (100 weak & 105 strong) now back firmly above 104 finding support with the golden cross. For now.. as the loose fiscal policy is the primary driver of this cycle and the direction is hyper-sensitive to Fed speakers and headlines.
Bitcoin Summary
Bitcoin price was $62k as of writing 2 weeks ago and we did get about 75% of the short squeeze I covered but fell short of $73k, thus forming a lower high in the short term. (also why I said downside until back above $73K over 3 weeks ago) I have been looking at March for the pullback since October and nothing has changed now that we are in it coming up to the halving.
BTC did however put in the highest monthly and weekly candle closes ever. So what now?
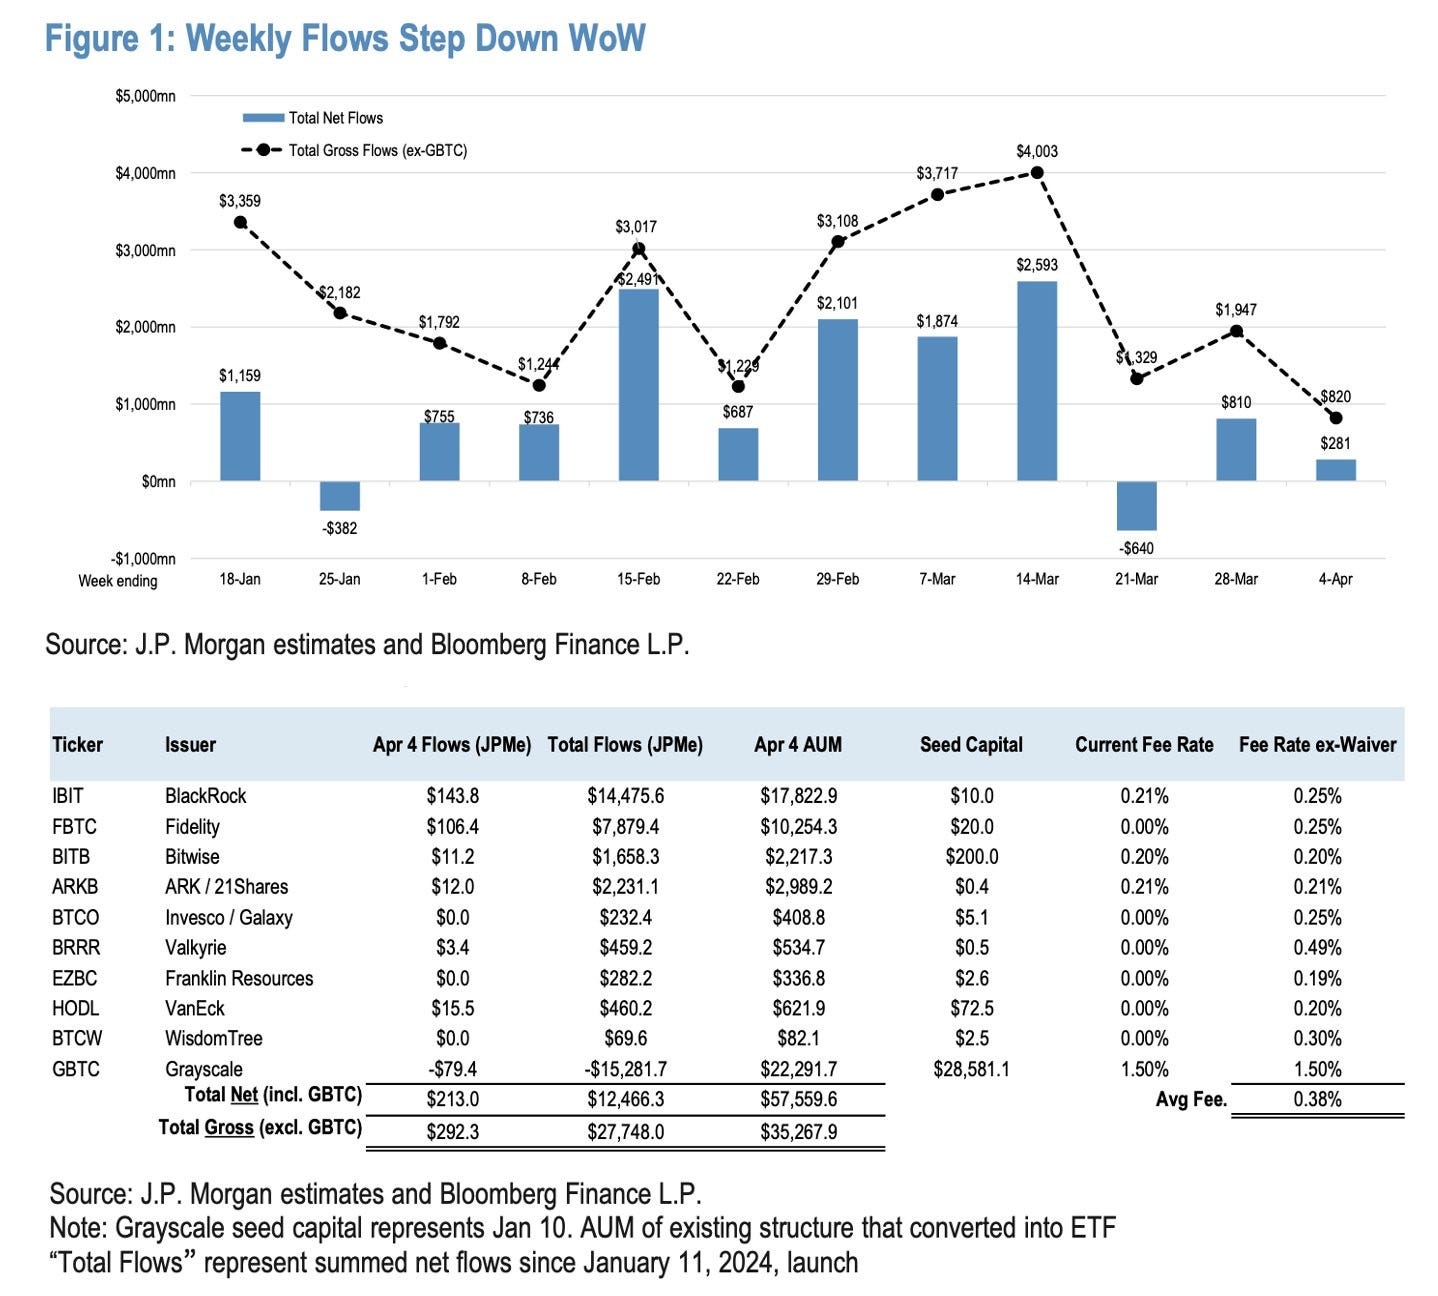
My base case is consolidating in this range until late April. IF we start ranging above $69K and the newest all-time high ($73K) through the halving, I would expect up only until a downside catalyst appears.. but any further downside now until the halving wouldn’t be out of the norm, considering the 300% run Bitcoin has been on over the last 15 months, tax season liquidity strains, and ETF flows slowing down considerably.
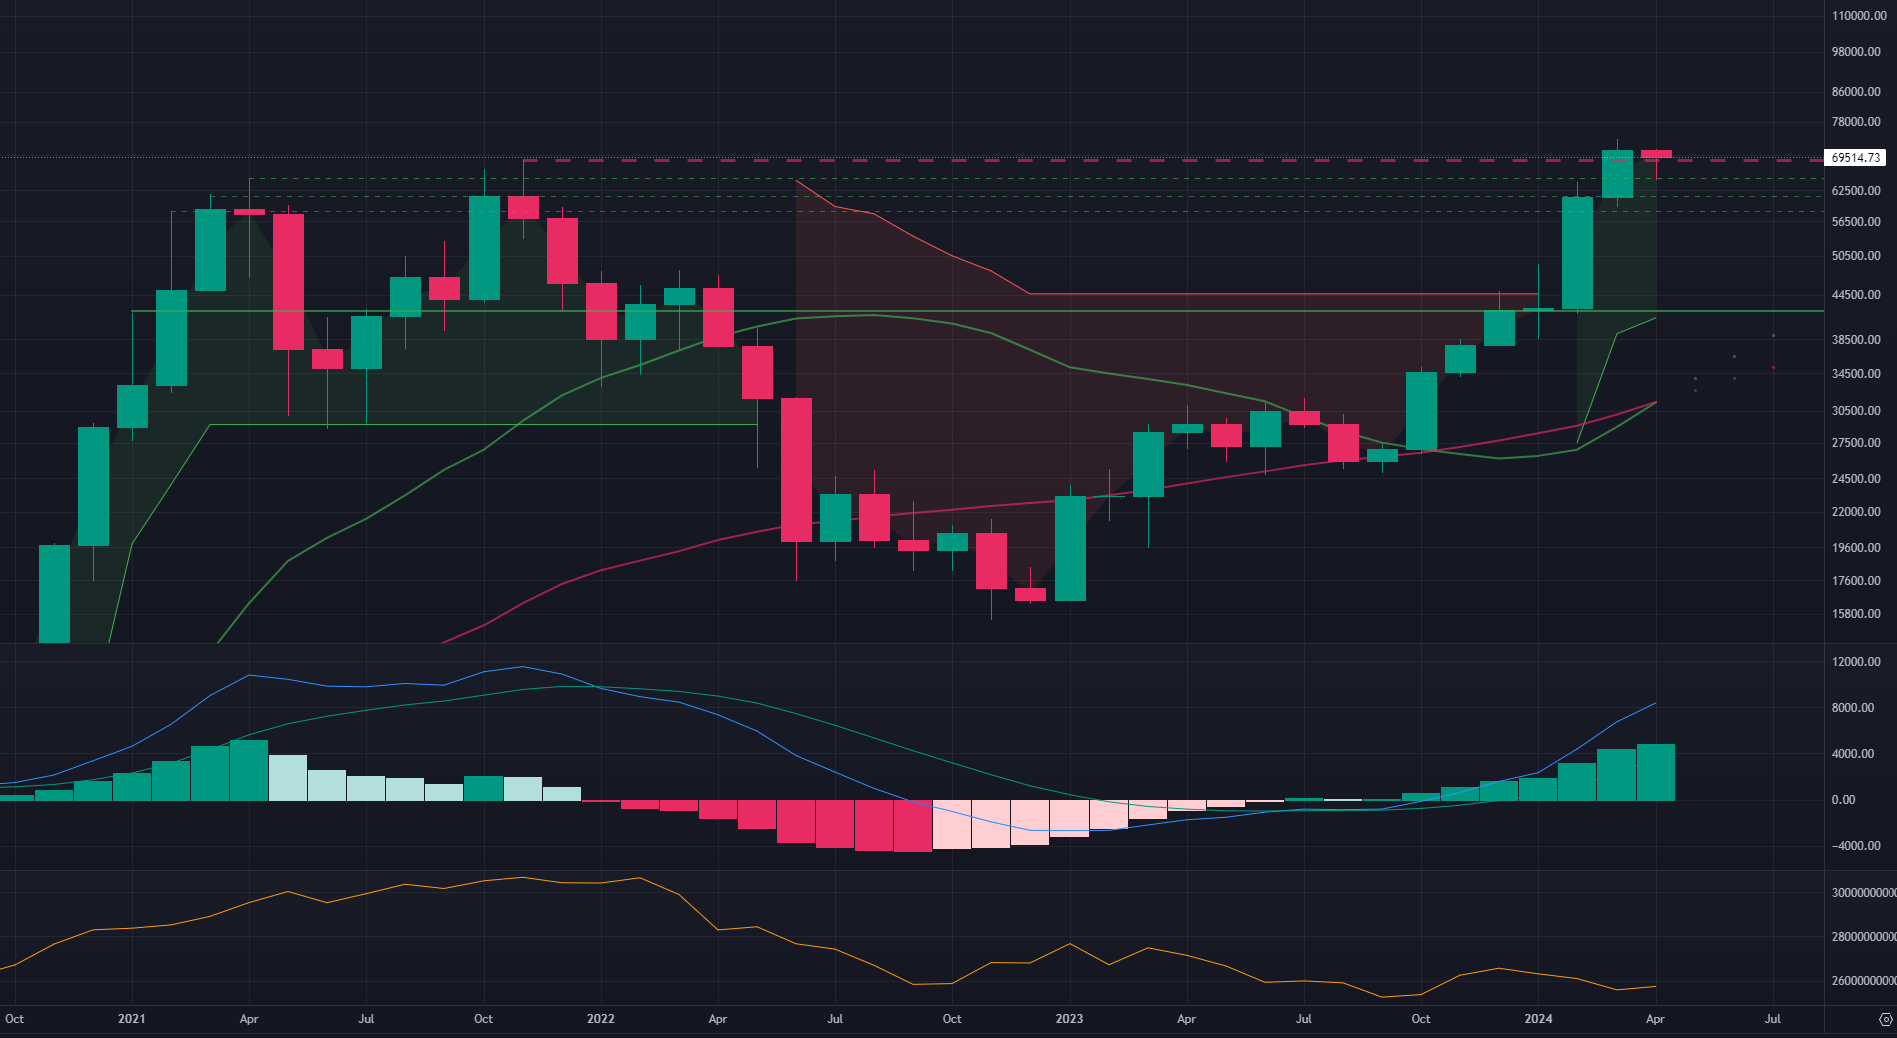
Bitcoin Monthly
Most notable on the monthly chart is that the 20ma and 50ma are bullishly crossing for the first time in history. Price would need to nuke down to the $40k level to break the long-term bullish trend and MACD has plenty of room.
BTC does not look bearish to me…
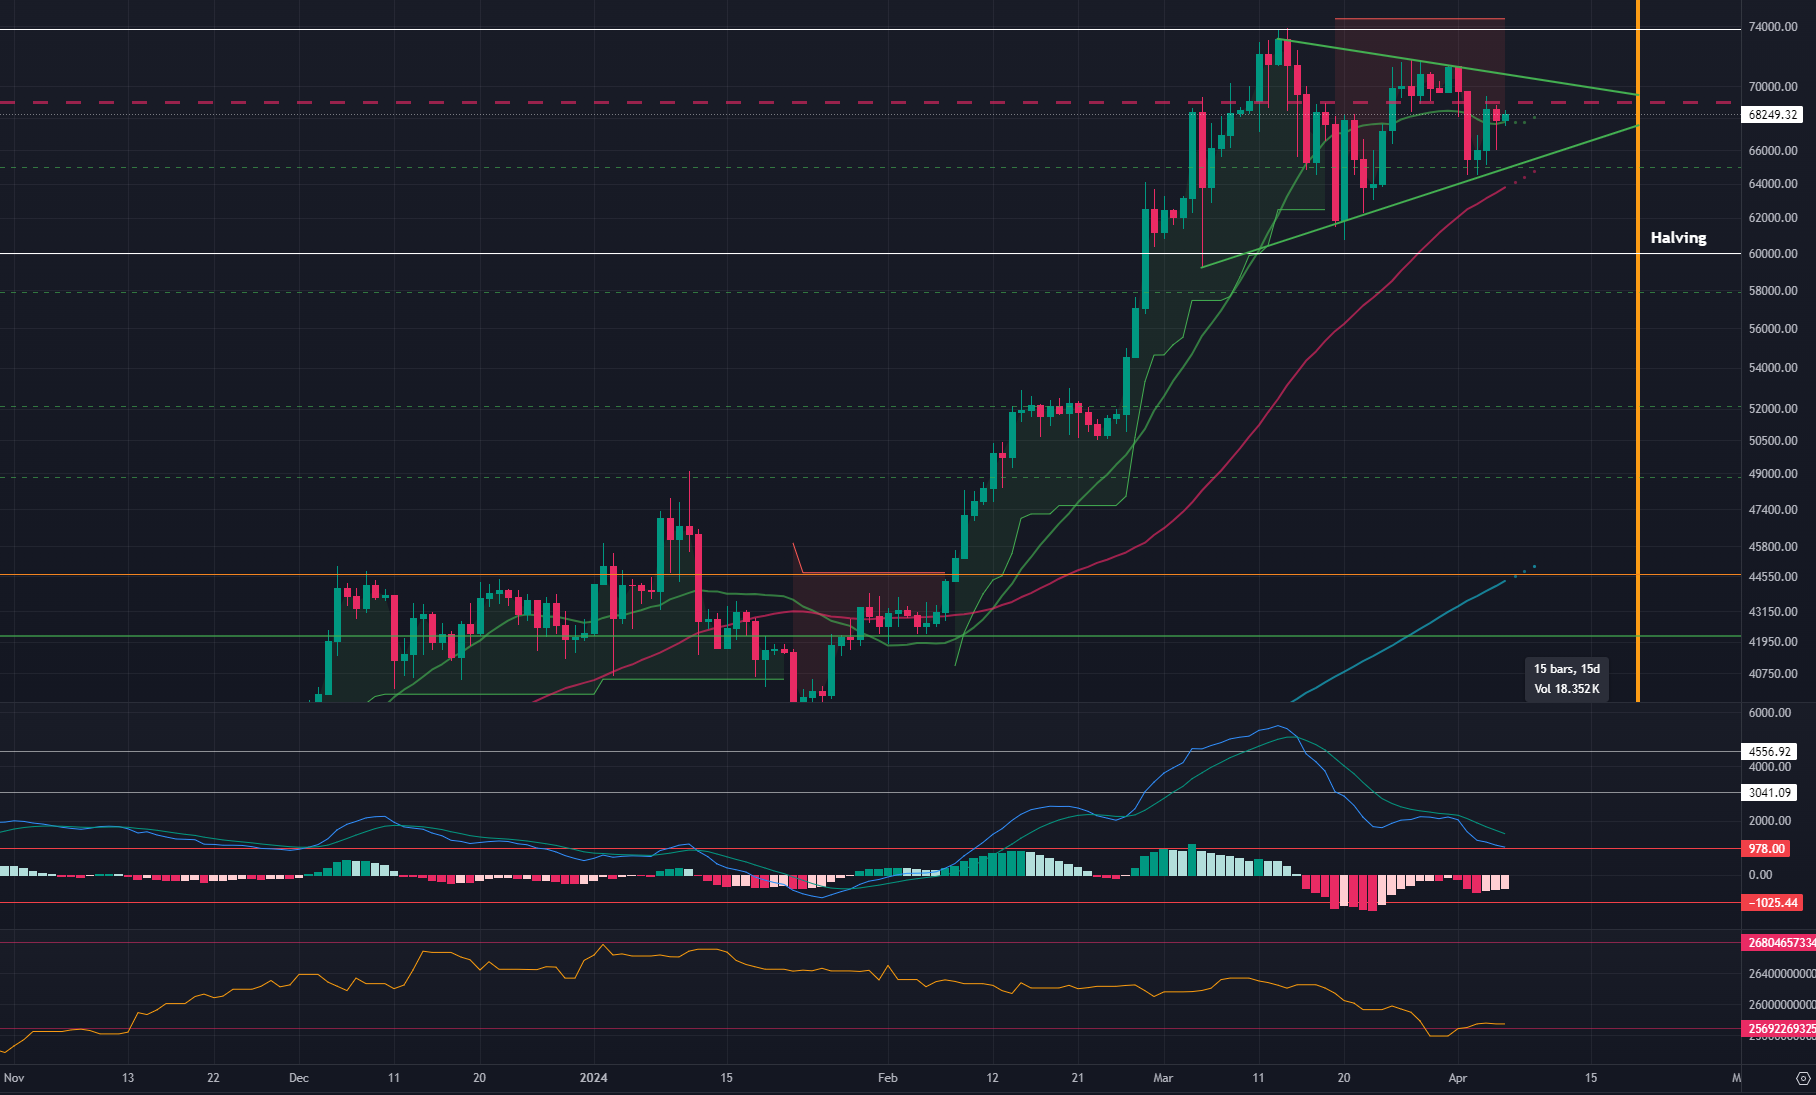
Bitcoin Daily
Resistance levels to watch: $70600, $71500, and final boss at $73500..
$85000-100K IF those levels break - I am less concerned if they will VS when they will. (pre or post halving)
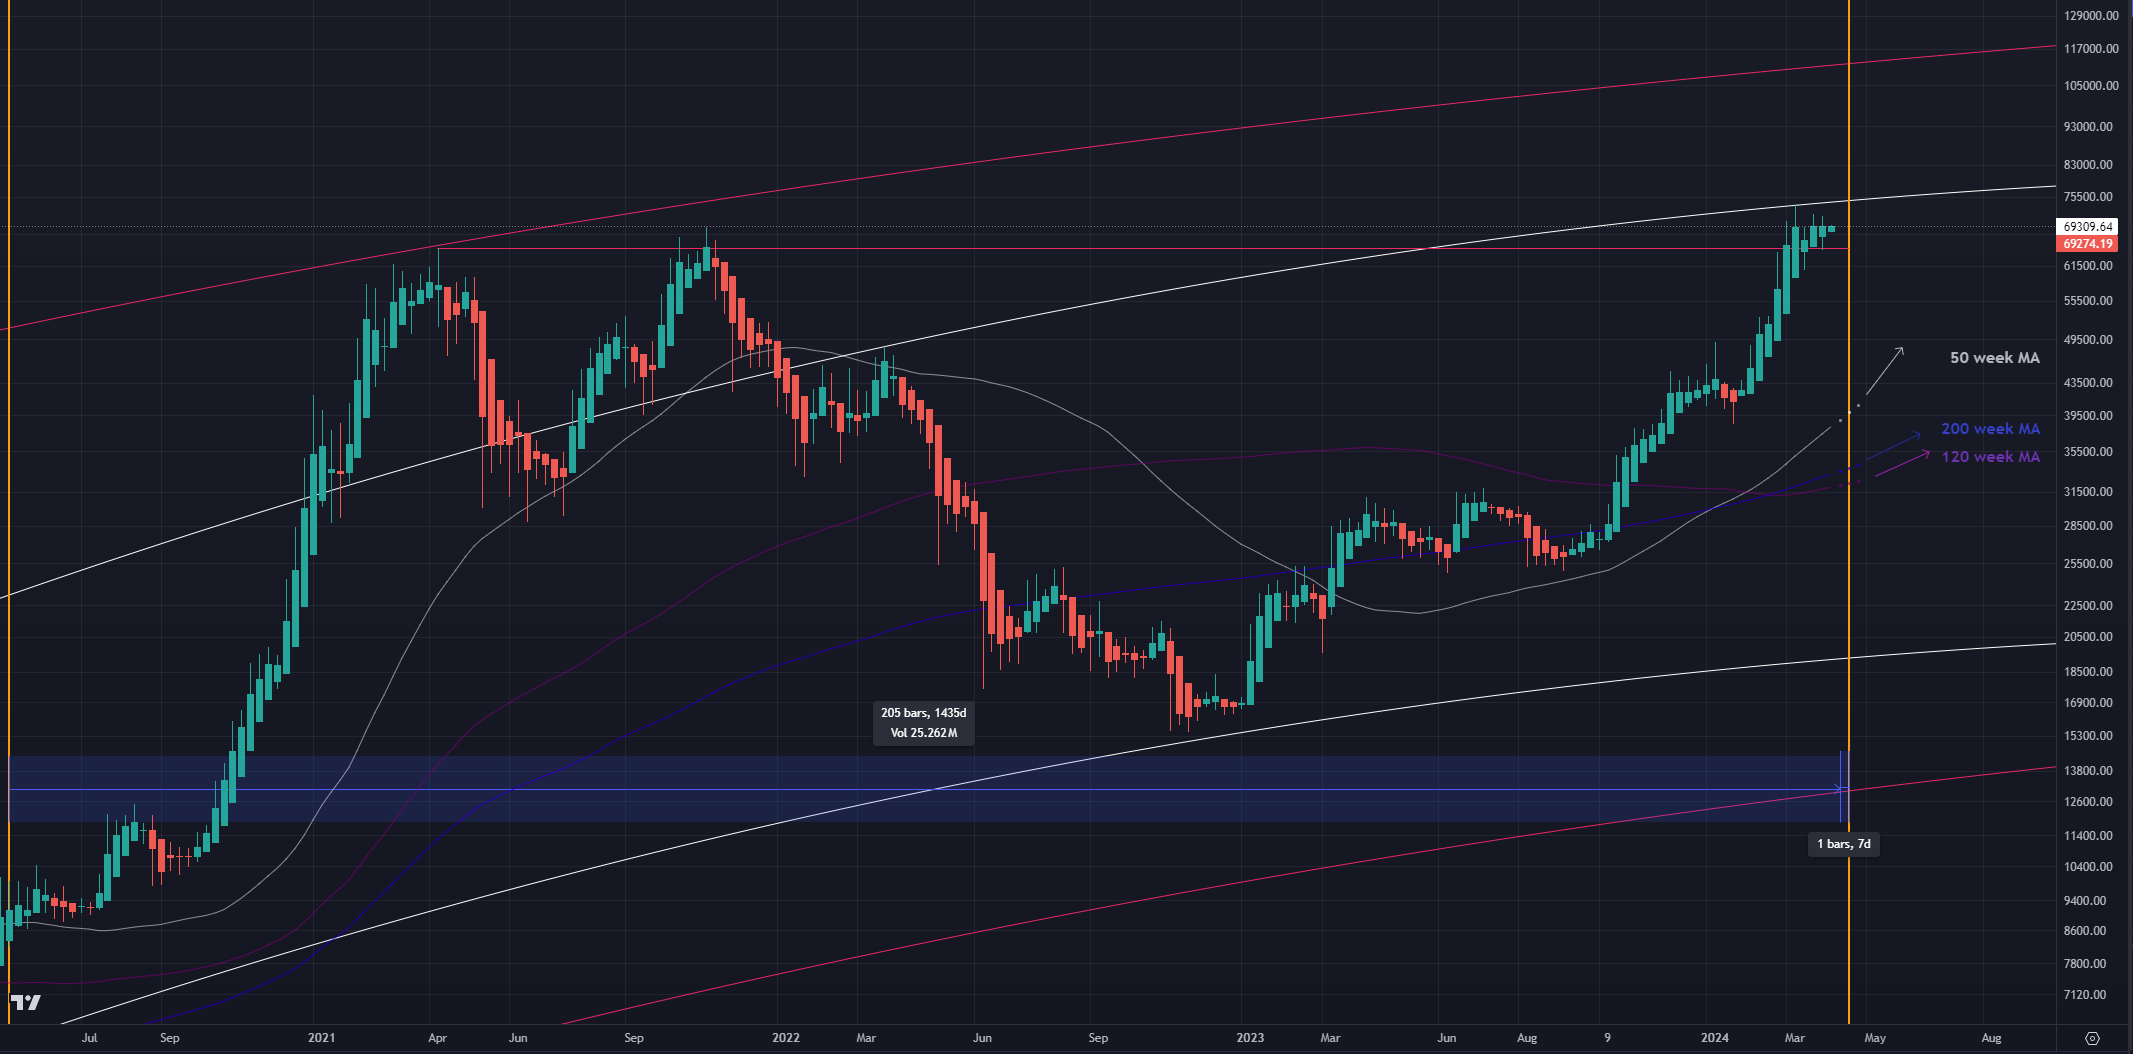
Bitcoin LRC Chart
The pullback in Heikin-Ashi candles is glorious.. looks more like consolidation above the prior all-time high, which we have seen before. Less than 2 weeks to Bitcoin halving and we are just chilling above $65K.

Author’s Note: This newsletter is currently free with subscriptions for extra content… If you like the content and want to support it, feel free to send Bitcoin to the address below. Regardless, I am so grateful to my readers and appreciate any feedback you have! You can find daily updates on my twitter and trade set-ups on my trading view.
bc1q3pt29zz38zctwszr8xzvvttuq9x02smex54ftp32c8jq0q74wewsc3tgy2