


Macro Winds Shifting?

Trad-Fi Market Summary
Took a few weeks off for the holiday, and I recorded a podcast with a killer macro alpha producer in the Less Noise, More Signal podcast that will be out soon - Give them a follow and hope you check it out!
U.S. and Significant Global Events (Week of June 30, 2025)
MONDAY, JUNE 30
U.S. Chicago PMI (June 2025)
Consensus Projection: Expected at ~44.5, signaling continued manufacturing slowdown.
Notes: Released at 9:45 AM EDT. Impacts regional manufacturing sentiment and industrial stocks. A reading below 50 indicates contraction, with tariff uncertainties and Middle East tensions likely weighing on confidence.
China Manufacturing PMI (Official, June 2025)
Consensus Projection: Expected at ~49.8, near contraction territory.
Notes: Released at 9:00 PM EDT (June 30, 9:00 AM CST July 1). Influences CNY, commodity markets, and global trade sentiment. Subdued domestic demand and U.S. tariff concerns remain key drivers.
TUESDAY, JULY 1
U.S. ISM Manufacturing PMI (June 2025)
Consensus Projection: Expected at ~50.0, indicating potential stabilization.
Notes: Released at 10:00 AM EDT. A critical gauge of U.S. manufacturing health; a beat could lift industrial stocks and USD, while a miss may heighten recession fears amid trade tensions.
Eurozone CPI (Flash Estimate, June 2025)
Consensus Projection: Expected at ~2.3% YoY, slightly above ECB’s 2% target.
Notes: Released at 5:00 AM EDT (11:00 AM CET). Impacts EUR and ECB rate expectations. Rising energy prices and Middle East conflicts could push inflation higher.
WEDNESDAY, JULY 2
U.S. ADP Employment Report (June 2025)
Consensus Projection: Expected at ~160,000 private jobs added.
Notes: Released at 8:15 AM EDT. A precursor to Friday’s Nonfarm Payrolls, influencing labor market expectations and USD. Recent labor resilience may face pressure from tariff-related uncertainties.
Japan Tankan Survey (Q2 2025, Final)
Consensus Projection: Large Manufacturers Index expected at ~11, reflecting cautious optimism.
Notes: Released at 7:50 PM EDT July 1 (8:50 AM JST July 2). Impacts JPY and Nikkei. Trade policy and yen strength remain focal points.
THURSDAY, JULY 3
U.S. Initial Jobless Claims (Week Ending June 28, 2025)
Consensus Projection: Expected at ~215,000 claims.
Notes: Released at 8:30 AM EDT. A key indicator of labor market health; lower-than-expected claims could support USD, July FOMC, and equities.
Eurozone Unemployment Rate (May 2025)
Consensus Projection: Expected to remain steady at ~6.4%.
Notes: Released at 5:00 AM EDT (11:00 AM CET). Impacts EUR and ECB policy outlook. Robust service sector employment may offset manufacturing weakness.
U.S. Markets Close Early for Independence Day
Notes: U.S. stock and bond markets close at 1:00 PM EDT ahead of the July 4 holiday. Reduced liquidity may amplify volatility in thin trading.
FRIDAY, JULY 4
U.S. Independence Day Holiday
Notes: U.S. markets closed. No major economic data releases scheduled. Global markets may see lower volumes, with a focus on geopolitical developments, including U.S.-China trade talks and Middle East tensions.
UK General Election (Projected Campaign Period)
Notes: While not confirmed for this date, campaigning may intensify if an early election is called. Impacts GBP and UK policy outlook, with trade and fiscal policy in focus.
Summary of Last Week’s Data Results (June 23–27, 2025)
U.S. S&P Global Flash PMI (June 2025)
Consensus Projection: Manufacturing PMI ~48.5, Services PMI ~53.0.
Result: Manufacturing PMI reported at 48.7, slightly above expectations, signaling modest stabilization; Services PMI at 53.2, reflecting service sector strength. USD gained modestly, but tariff concerns limited upside. Industrial stocks saw mixed performance.
U.S. Consumer Confidence (Conference Board, June 2025)
Consensus Projection: Expected at ~96.0.
Result: Reported at 95.8, slightly below consensus, driven by tariff and inflation concerns. Retail stocks dipped, and USD softened marginally.
Eurozone Industrial Production (May 2025)
Consensus Projection: Expected at 0.2% MoM growth.
Result: Flat at 0.0% MoM, reflecting manufacturing weakness amid trade uncertainties. EUR weakened slightly; ECB rate cut expectations held steady.
China Caixin Manufacturing PMI (June 2025)
Consensus Projection: Expected at ~51.5.
Result: Reported at 51.8, indicating modest expansion. CNY and Asian markets saw slight gains, though U.S.-China trade talks capped optimism.
U.S. Supreme Court Rulings (June 27, 2025)
Result: The Supreme Court issued decisions on six remaining cases, including limiting lower courts’ ability to block executive actions via universal injunctions. No ruling on Trump’s birthright citizenship executive order, but the court upheld the Affordable Care Act’s preventive care provisions. Markets reacted neutrally, with focus on trade and geopolitical developments.
U.S. Airstrikes on Iran Nuclear Facilities (Announced June 27, 2025)
Result: President Trump announced U.S. airstrikes on Iran’s Natanz, Fordow, and Esfahan nuclear facilities. CIA Director John Ratcliffe and DNI Tulsi Gabbard claimed significant destruction, setting Iran’s nuclear program back years, though a leaked DIA report suggested a shorter delay. Oil prices surged nearly 10%, impacting global inflation expectations. Markets rotated toward defensive sectors, and USD strengthened.
Global Equity Markets (Week Ending June 27, 2025)
Result: S&P 500 and Nasdaq closed at record highs despite trade tensions and Middle East conflicts. Investors shrugged off volatility, with defensive sectors gaining traction. Dow Jones saw milder gains, reflecting tariff concerns.

Liquidity Summary (Fed liquidity guide)
Domestic liquidity (Fed NL) was negative last week $59B due to RRP build and Fed balance sheet reduction outpacing bank reserve growth and TGA rundown.

Reverse Repo Market (RRP):
The RRP continues to rise as the TGA runs down and into month-end window dressing, which will be used to offset the TGA refill when it occurs this year.
Treasury General Account (TGA):
The TGA continues to drain with small spikes due to tax receipts and emergency measures. (AKA borrowing 401ks and pensions from Fed workers) All eyes are on the OBBB passing by July 4 to raise the debt ceiling, which triggers a Treasury flood of issuance to refill the TGA.
The Federal Reserve's H.4.1 report for the week ending June 25, 2025, highlights notable changes in bank flows and reserve balances. Total factors absorbing reserve funds, other than reserve balances, increased by $33.626 billion week-over-week, reaching a height of $3.366 trillion.
Other Deposits with Federal Reserve Banks: Grew by $66.681 billion to $3.347 trillion, indicating a significant rise in non-reserve deposits by depository institutions. Foreign Official and International Accounts: Rose by $11 billion to $438 billion, reflecting substantial growth in foreign holdings.
Fed Balance Sheet (QE/QT):
Reduced QT continues to trickle in, and no comments from the Fed on changing that stance. The balance sheet has shrunk by $19B in June thus far and will continue at the current pace until policy supports any changes.
For a complete view of global liquidity, projections, and how we are positioning, see the Macro Timeline Update and join the chat for premium members.
Federal Reserve & Co.
Based on the CME FedWatch Tool's conditional meeting probabilities as of June 28, 2025, there is a notable shift in expectations toward a potential Federal Reserve rate cut in July 2025, with a 18.6% probability for a 175-200 basis point cut and an 81.4% probability for a 425-450 basis point cut. This suggests growing market anticipation of a significant monetary policy easing if economic data supports such a move in 2025. Subsequent meetings in September and October 2025 also show increasing probabilities of cuts, with September reaching a 74.8% chance for a 425-450 basis point reduction and October at 28.1% for a similar range.
Some Fed speakers began a pivot toward a dovish stance, emphasizing data-dependent decisions, particularly if inflation cools or employment weakens, to justify an earlier cut. Even Powell is hedging his tariff inflation comments with “We could see inflation come in not as strong as expected, if that’s the case, we would suggest cutting sooner.” Regardless of what happens in 2025, the odds of Trump putting in an uber dove as Fed chair to drop rates appear very likely.

USD VS Everyone Else
The Dollar Index (DXY) closed at 97.254 on June 27, 2025, down 2.15% from 99.39 the prior week, marking its fourth consecutive weekly decline and seventh straight monthly drop. The DXY briefly dipped below the 99.0 support level, pressured by easing U.S. fiscal concerns, reduced trade policy fears, and investor flows toward higher-yielding foreign assets, particularly in Europe (EUR) and Japan (JPY). A June 24 Truth Social post from President Trump hinting at progress in EU trade negotiations provided fleeting Dollar support, but renewed U.S.-China trade tensions, highlighted by a June 26 post criticizing China’s AI chip restrictions, capped gains.
U.S. economic data on June 26 showed mixed signals. May’s Core PCE rose 0.2% month-on-month, above the 0.1% forecast, with the year-on-year print at 2.7%, exceeding the 2.6% expected. Headline PCE met expectations at 0.1% month-on-month and 2.3% year-on-year, up from a revised 2.2%. Personal income fell 0.4%, missing the 0.3% forecast, while real consumption dropped 0.3%. The Atlanta Fed’s GDPNow Q2 estimate was revised down to 2.9% from 3.4%. The June 27 jobs report added 142k nonfarm payrolls, slightly above the 140k expected but down from a revised 145k. Two-month net revisions fell to -90k, signaling labor market softening. The unemployment rate held at 4.2%, below the Fed’s 4.5% year-end projection, with wage growth slightly above forecasts. Money markets now price in 40bps of Fed rate cuts for 2025, with a 75% chance of a second cut by November.
U.S. Trade: The Advance International Trade in Goods report showed the U.S. trade deficit narrowing to $82.7 billion in May, down $1.6 billion, driven by a $62.8 billion drop in imports to $273.1 billion. Earlier 2025 deficit surges tied to pre-tariff import spikes ahead of Trump’s Liberation Day tariffs (April 2) continued to moderate, supporting Q2 GDP.
U.S.-China trade tensions escalated, with Treasury Secretary Scott Bessent noting on June 25 that talks remained stalled. The Trump administration expanded sanctions on China’s tech sector, targeting AI chip and aerospace exports. USTR Jamieson Greer accused China of manipulating rare earth markets, while Trump claimed on June 26 that China violated trade commitments. A June 27 call between Trump and President Xi Jinping resulted in plans for new trade talks, with U.S. and Chinese teams set to meet soon, though details remain unclear.
Canada-US looks like trade war back in effect as Trump advised that the US will be terminating all trade talks and they will be advising their new tariff level within the next 7 days.
EU trade negotiations advanced, with a June 26 joint statement from EU Trade Chief Valdis Sefcovic and USTR Katherine Greer confirming tariff de-escalation efforts. The EU’s €95 billion countermeasures remain on hold, with Bloomberg reporting confidence in a deal by July 9. German May industrial production rose 0.9% month-on-month, supporting Eurozone resilience.
CNY/USD: The Yuan was stable, with USD/CNY at 7.1920, down 0.08% week-on-week. The PBOC maintained steady interventions, and China’s June PMI rose to 51.2, signaling expansion. However, slowing export growth raised concerns amid U.S.-China frictions. The PBOC’s Q2 meeting emphasized Yuan stability and enhanced interest rate guidance.
JPY/USD: The Yen gained, with USD/JPY closing at 140.80, down 0.28% from 141.20. Safe-haven demand supported JPY amid U.S. equity volatility. Japan’s May retail sales grew 0.5% month-on-month, while the BoJ held its 0.25% rate. Support is at 140.00, resistance at 141.50. 30-year JGB yields are up 75 bps YTD.
EUR/USD: The Euro rose, with EUR/USD at 1.1720, up 0.43% from 1.1670. Strong German data (0.9% industrial production growth) and easing U.S.-EU tariff fears drove gains. June 26 Eurozone inflation data showed moderation, with markets eyeing softer readings next week. ECB signals of a potential July rate cut capped upside. Support is at 1.1650, resistance at 1.1800. A DXY rise above 99.5 could pressure EUR/USD. In North America, Canada’s Q2 GDP beat expectations, but USD/CAD spiked to 1.3780 from 1.3700 after Trump’s June 26 Truth Social post terminating Canada trade talks over its Digital Services Tax. Trump threatened tariffs within seven days, prompting risk-off CAD moves.
Emerging Markets (EMFX): High-beta EM currencies gained, buoyed by U.S.-China trade talk optimism and Asian demand. The Indonesian Rupiah (IDR) and Mexican Peso (MXN) rallied, while the Brazilian Real (BRL) firmed. The Turkish Lira (TRY) weakened amid inflation concerns, and the South African Rand (ZAR) was flat. The Colombian central bank held rates at 9.25%, while the Reserve Bank of India’s prior 50bps cut to 5.50% supported EMFX sentiment. ING analysts note U.S. policy shifts and global demand as tailwinds for Asian EMFX, though Trump’s Canada tariff threats sparked risk-off moves late in the week.
Bitcoin Summary
Regulatory Shifts: Texas signed a Strategic Bitcoin Reserve into law in June 2025. States like Arizona and New Hampshire allow up to 5% of reserves in Bitcoin. Japan’s Financial Services Agency proposed legalizing Bitcoin ETFs, potentially reducing crypto taxes. Vietnam and Pakistan show growing government interest in crypto frameworks.
Buying Pressure: Over 30% of Bitcoin’s circulating supply is held by centralized entities (exchanges, ETFs, companies, sovereigns). BlackRock’s iShares Bitcoin Trust (IBIT) holds $16.3B, with a 196% increase in institutional ownership in Q4 2024. Bitcoin ETF Inflows: ~$1.7 billion in net inflows this week (June 23-27, 2025). Public Companies Holding Bitcoin: 124+ companies own ~3.2% of Bitcoin supply (673,897 BTC), worth over $87 billion. Recent Corporate Purchases: Metaplanet: Added 1,234 BTC ($132.7M) and 1,111 BTC ($118.2M), totaling 12,345 BTC. The Blockchain Group: Bought 182 BTC (~€17M). Smarter Web Company: Acquired 74.27 BTC, totaling 242.34 BTC.
All of this as the Fed is neutral and policy paused…
Bitcoin Daily
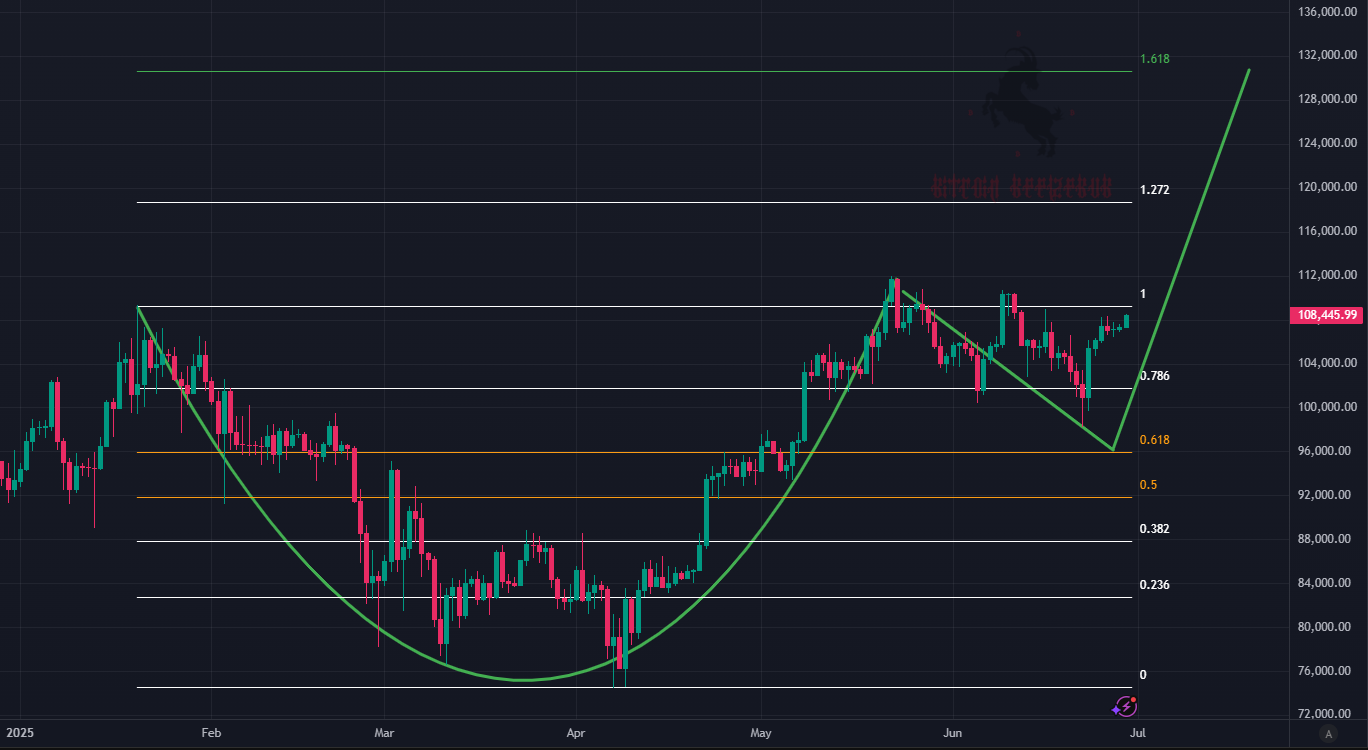
I try to avoid moonboi posting, but here is an observation I made back in October when the price was $65,000 that hit the $107,000 Fibonacci target perfectly, and it is hard to ignore the similar pattern now.

Which looks eerily similar to MSTR 0.00%↑
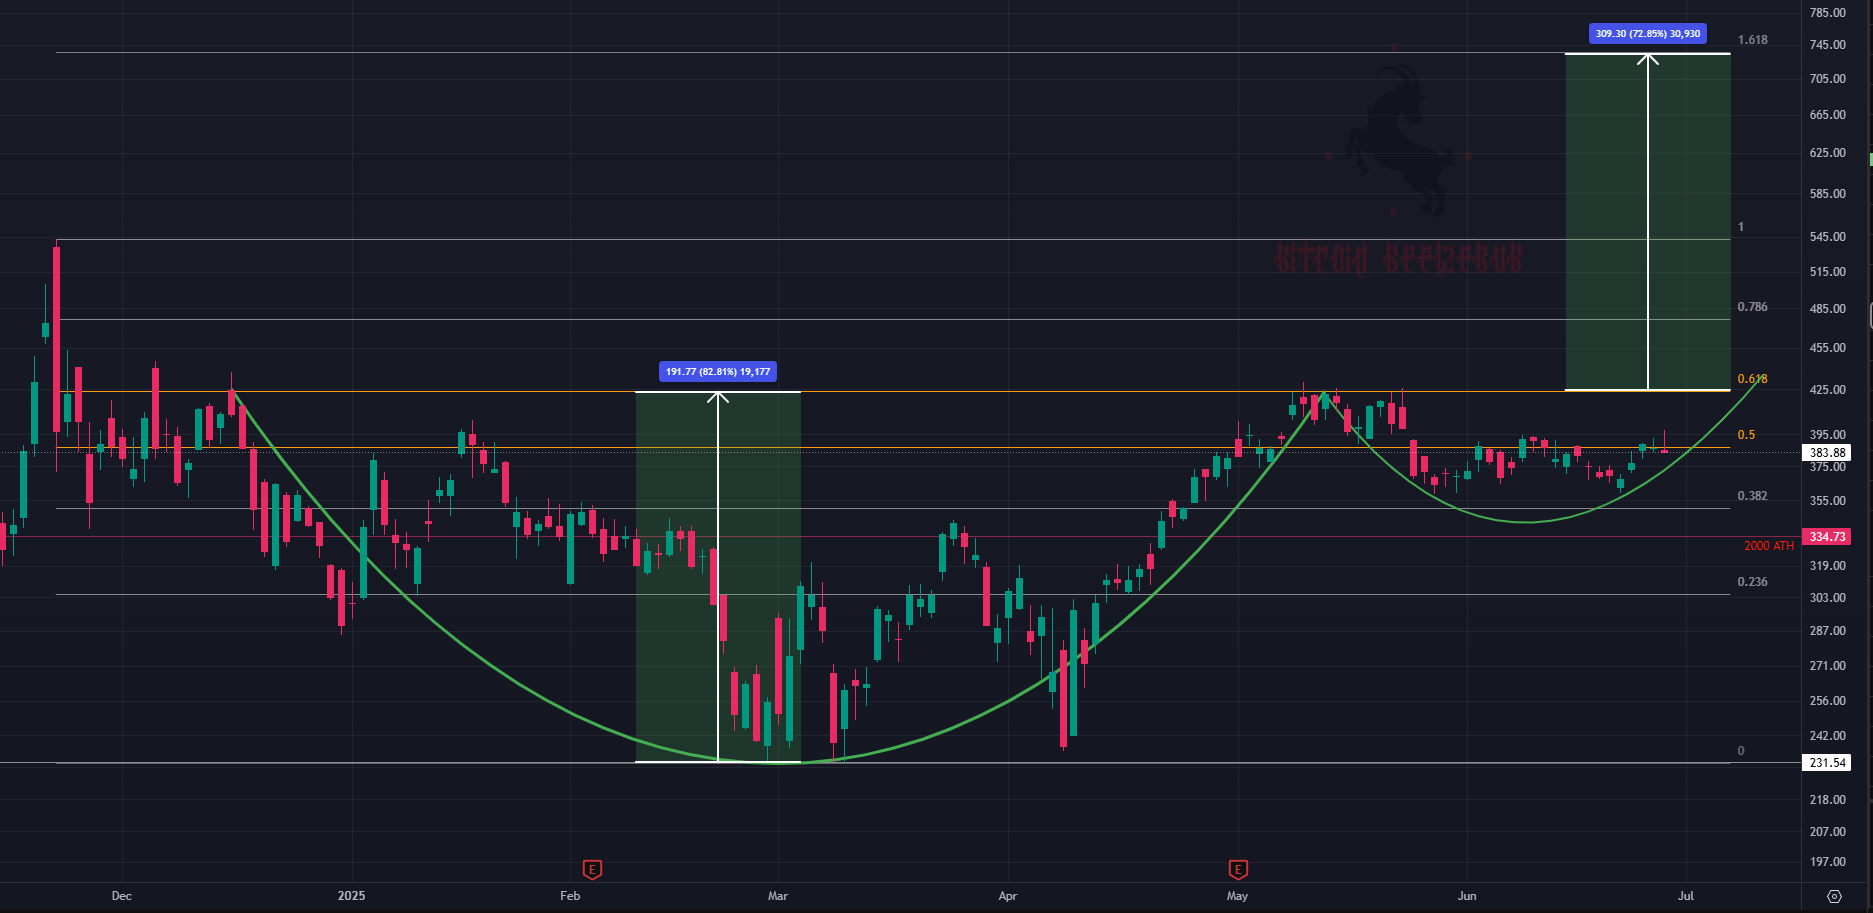
These patterns do not have to play out and macro can fall apart fast based on tariffs, war escalation, liquidity crisis, etc. etc. etc. BUT in the game of probabilities, I like the odds.
Bitcoin LRC Chart
Green flip - Are you ready?
