Trad-Fi Market Summary
Here's a detailed macro-economic calendar for the week starting from January 04, 2025, with specific dates and times:
US Non-Farm Payrolls (NFP) - Scheduled for Friday, January 10, 2025, at 8:30 AM EST. This is a critical indicator for employment in the US, expected to influence markets due to its impact on monetary policy decisions.
FOMC Minutes - The minutes from the last Federal Open Market Committee meeting will be released on Wednesday, January 8, 2025, at 2:00 PM EST. These minutes provide insights into future monetary policy directions.
ISM Services PMI - This index, measuring the activity level of the services sector in the US, is set for release on Thursday, January 9, 2025, at 10:00 AM EST. It's crucial as services make up a significant portion of the economy.
China Inflation Data - Expected on Tuesday, January 7, 2025 (time not specified, typically around 9:30 PM EST). This data will shed light on inflationary trends in one of the world's largest economies.
Eurozone Inflation Data - Scheduled for Thursday, January 9, 2025 (time not specified, usually around 5:00 AM EST). These figures are vital for understanding the economic health of the Eurozone and potential policy adjustments by the ECB.
US ISM Manufacturing PMI - On Friday, January 10, 2025, at 10:00 AM EST, this event will offer insights into the manufacturing sector's performance. The forecast suggests a slight decrease to 48.3 from 48.4, indicating potential contraction.
US Construction Spending - Data will be released on Monday, January 6, 2025, at 10:00 AM EST, providing a snapshot of the construction sector's health.
US Jobless Claims - Weekly jobless claims are due on Thursday, January 9, 2025, at 8:30 AM EST, offering insights into labor market conditions.
US Vehicle Sales Data - This will be available on Monday, January 6, 2025 (time varies by manufacturer, typically around market open). It gives insights into consumer spending and confidence in the automotive sector.
Liquidity Summary (Fed liquidity guide)
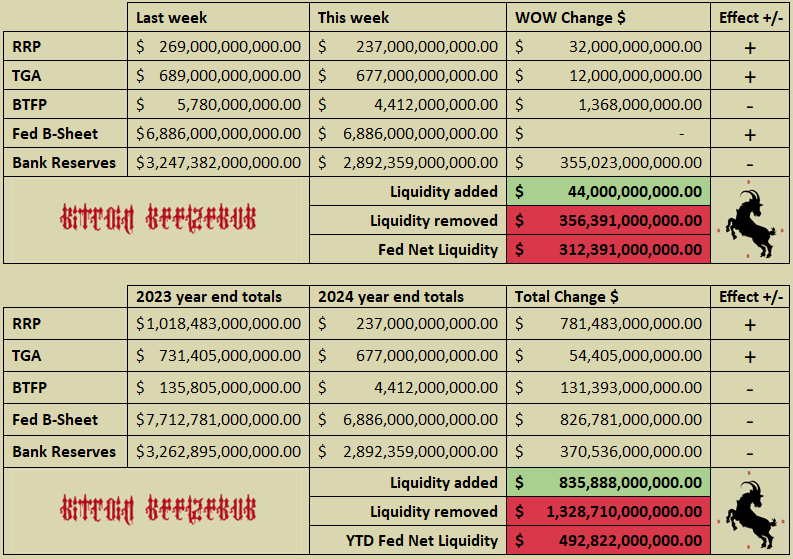
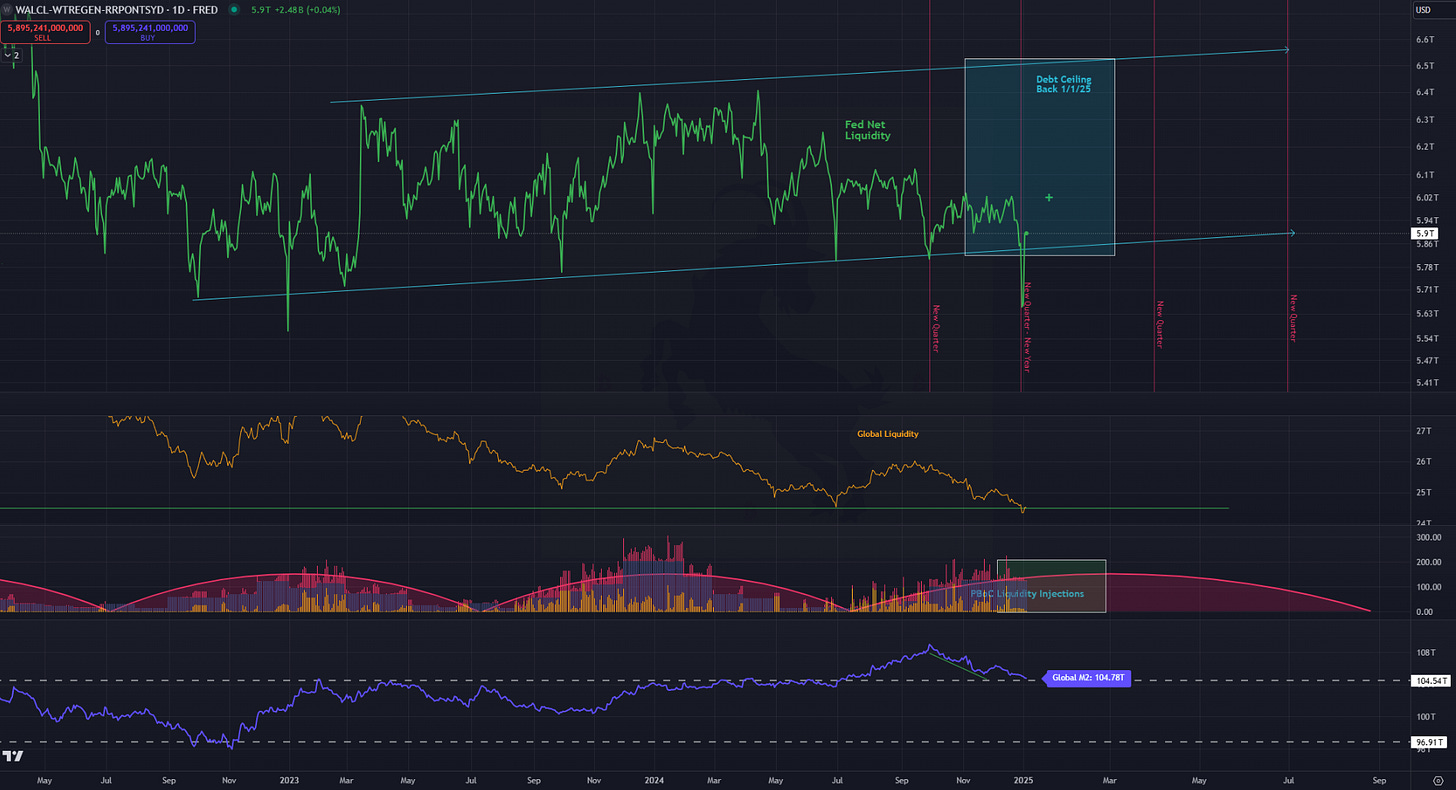
U.S. domestic Fed net liquidity was negative $312B last week of the year, largely due to bank reserves and RRP window dressing. However, the true outlook of YOY domestic liquidity is the story of shadow stimulus versus public quantitative tightening. Excluding bank reserves, the Fed only managed to suck out $122B, and excluding window dressing ($280B in RRP last few days) it was flat on the year. AKA stealth QE has outpaced public QT exactly as outlined at the beginning of 2024.
Global liquidity is another story entirely - largely trending down due to China’s PBoC and their lack of delivering the stimulus needed to defend their currency pair to DXY, which has been surging recently. It is expected that liquidity will remain ample through 2025 but the wall of debt maturity will continue to quil large breakouts as once expected.
For a complete view of global liquidity, projections, and how we are positioning see the Macro Timeline Update and join the chat for premium members.
Secured Overnight Financing Rate (SOFR):
The SOFR has seen some volatility to close the year largely due to window dressing (bouncing between 4.3% on December 19 to 4.53% on December 26 and now back to 4.4% as of writing). As outlined last week, these spikes are unlikely to cause any plumbing issues because liquidity is not the problem right now. it is the Fed’s balance sheet congestion that is the problem.
The Federal Reserve, in addition to its standard afternoon activities, announced it would conduct morning Standing Repo Facility (SRF) operations over the year-end period. This move indicates the start of the Fed's strategy to manage repo market dynamics. Discussions with market participants revealed that central bank officials were open to morning operations, which encouraged traders to secure repo agreements at lower interest rates. However, there was still a reluctance to use the SRF directly. This was clear when, despite repo rates trading well above the Fed's lowest SRF rate, no transactions were made through the facility at year-end. This suggests a lingering stigma associated with using the SRF.
Reverse Repo Market (RRP):
The RRP was the main culprit of window dressing where dealers avoided money market funds' cash to clean up their balance sheets. The balance went from $98B on 12.20 after the Fed reduced the ON-RRP rate by 30bps before filling back up to a high of $473B on 12.31. As projected, a little less than half was removed on the first of the month and now we see how fast the remaining balance drains to zero.
Treasury General Account (TGA):
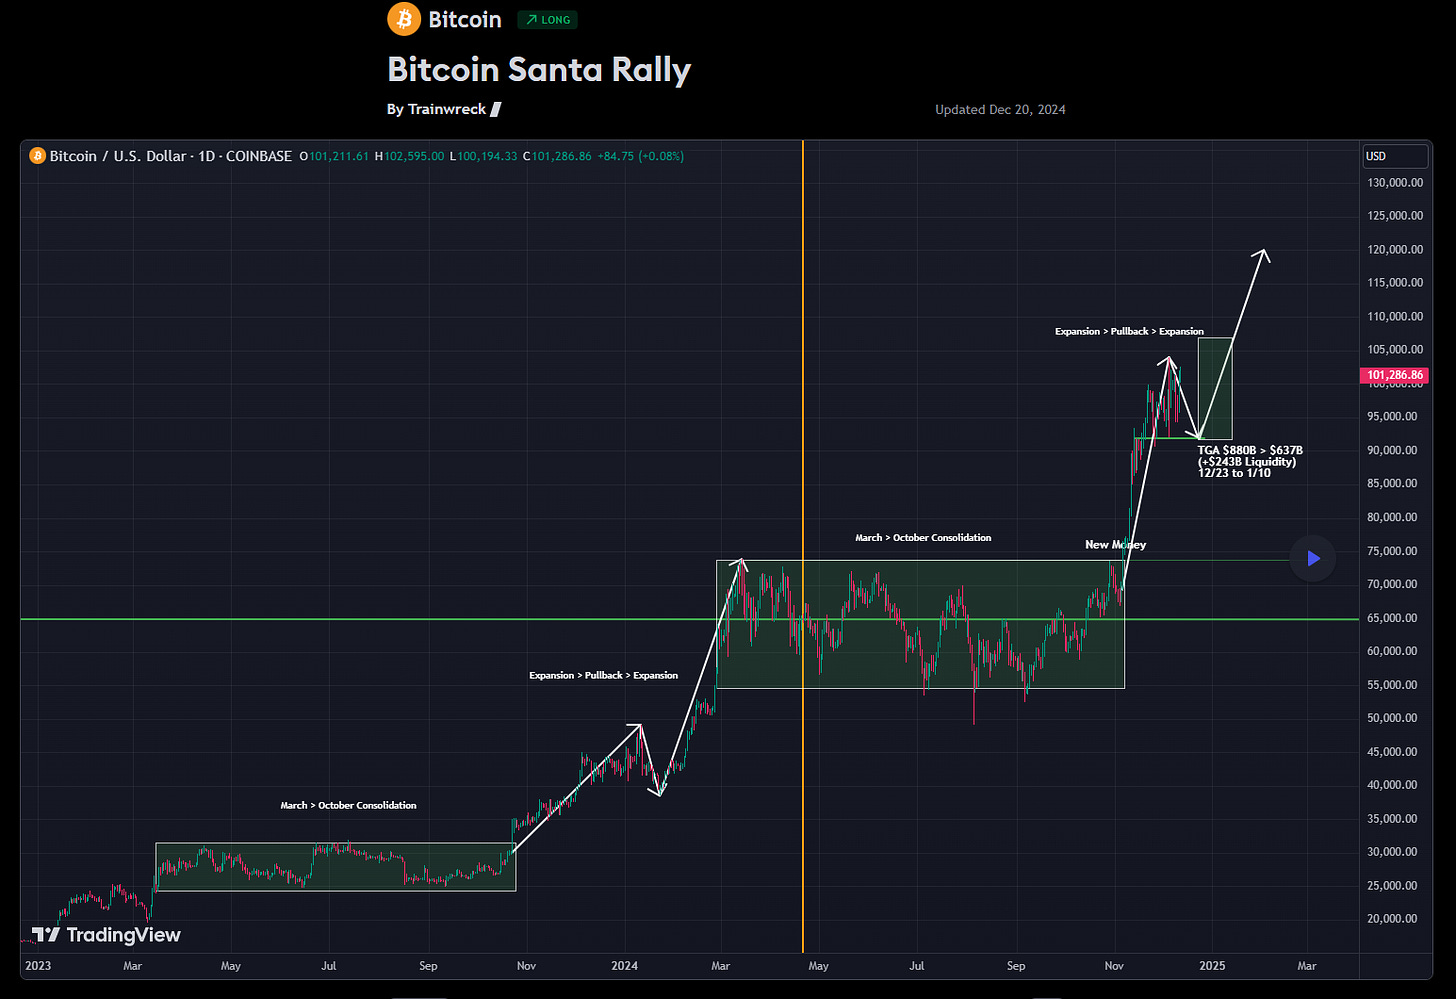
The window of peak and trough outlined in my free post on Trading View has played out exactly correct thus far giving a $200B reduction of liquidity for year-end and now ascending to a low of $590B and constraint level. (this is without the Treasury needing to implement $1 dollar of extraordinary measures ($300B available if needed) The Bitcoin directions and timeline playing out perfectly as well - hit play on that trading view set up…. you are welcome.
Projection rough estimates (fast resolution of debt ceiling = nothing burger)
Bank Flows (Defunct BTFP):
In the final week of 2024, money market assets hit a new peak at $6.848T, while simultaneously, bank deposits saw inflows for the fifth consecutive week, fully recuperating losses from the SVB crisis. On a seasonally adjusted basis, banks recorded $58.5B in deposit inflows following three weeks of outflows. On a non-adjusted basis, they experienced a fifth week of deposit increases, adding $31.5B, nearing record levels. However, Small Domestic Banks, excluding foreign deposits, faced significant outflows around Christmas, unlike Large Domestic Banks which saw inflows. Both small and large banks reduced their loan volumes during this period. That said, the Fed's H.4.1 report has bank reserves below the $3T constraint level (at $2.8T) largely due to the year-end window dressing of the RRP.
As covered weekly here, the Federal Reserve's Bank Term Funding Program (AKA 2023 bank bailout program) has nearly wound down 100% of those loans, now at $4.4B, down from a high of $168B.
Fed Balance Sheet (QE/QT):
The Fed’s balance sheet was flat this week with no QT done - all things equal this is net neutral. Based on the RRP balance it is likely that the Fed will end its balance sheet reduction in 2025 and the sooner that is drained to zero the sooner action will be taken.
Federal Reserve & Co.
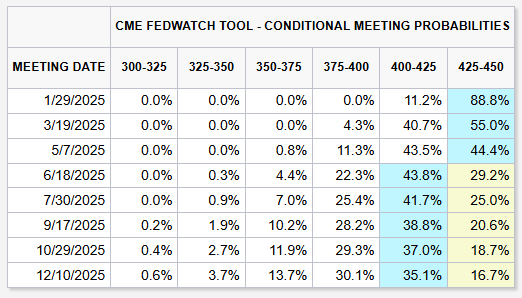
Literally zero change in CME projections for the EFFR (the Fed Funds rate) and that is likely to remain the case until we get some more data prints and clarity from the incoming Trump Admin.
USD VS Everyone Else
The U.S. dollar has continued to see a sharp rise in its index (DXY) contrary to expectations that such a rise might indicate a liquidity crunch, this surge is primarily attributed to market dynamics reflecting two key factors: the pricing in of the "Trump trade" and the relative economic and political weakness in Europe.
Investors are betting on continuing policies that favor a stronger dollar, including potential tax cuts, deregulation, and trade barriers which could lead to higher inflation and interest rates in the U.S. compared to other economies. (after hitting my target projected in November, My bet is that the top is in until the end of Jan) However, it is still unclear what a Trump negotiation tactic is versus what will be implemented in Trump 2.0. That said, we can expect this trend in dollar strength to continue until the Fed ends quantitative tightening and or starts quantitative easing (unlikely without a major catalyst) or Trump and the new Treasury Sec Bessent implement a plan to sort out the T-bill tsunami Yellen left for them in the next international deal.
Going back to Trump 1.0, Trump and some of his advisers, like Peter Navarro and Robert Lighthizer, expressed dissatisfaction with the strong dollar policy, suggesting that devaluing the dollar to reduce trade deficits could benefit U.S. exporters by making American goods cheaper abroad.
CNY: The dollar has maintained a relatively stable position, with minor fluctuations. The CNY has been trading around 7.3344 per dollar, indicating no significant shift in dollar strength against the yuan in this period. This stability might be attributed to ongoing trade tensions and China's cautious monetary policy, which aims to manage its currency's value without alarming markets
JPY: The pair has seen a slight appreciation of the dollar, with the yen falling by approximately 0.3% to around 157.69 per dollar. This movement suggests a strengthening dollar relative to the yen, possibly driven by the anticipation of a dovish Bank of Japan policy, which continues to keep interest rates low compared to the U.S., making the dollar more attractive for yield-seeking investors.
EUR: The Euro has been little changed against the dollar, trading at around $1.0351. This stability can be seen in light of the European Central Bank's (ECB) cautious approach towards interest rates, which contrasts with the Federal Reserve's more hawkish stance. The lack of significant movement in the EUR/USD pair might reflect market expectations of continued policy divergence between the U.S. and the Eurozone.
Bitcoin Summary
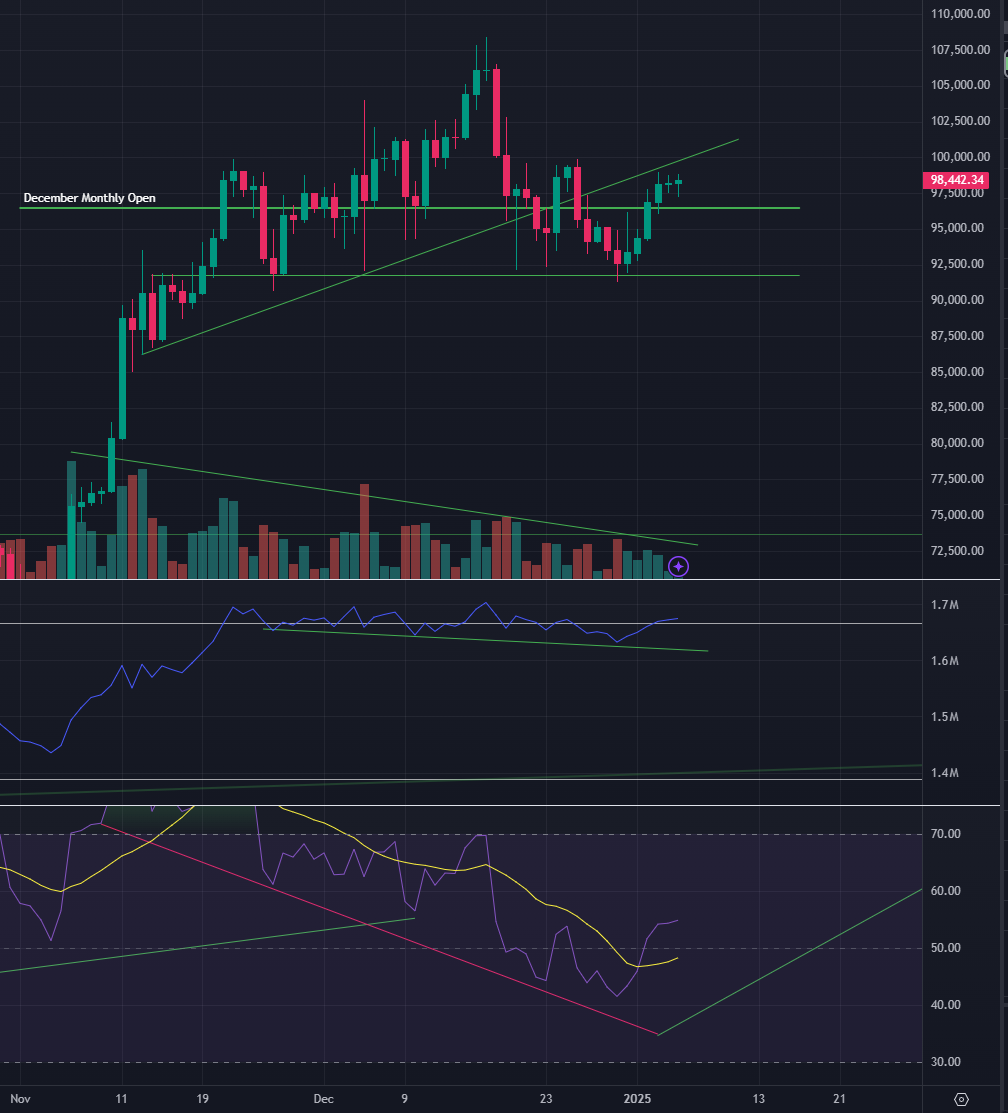
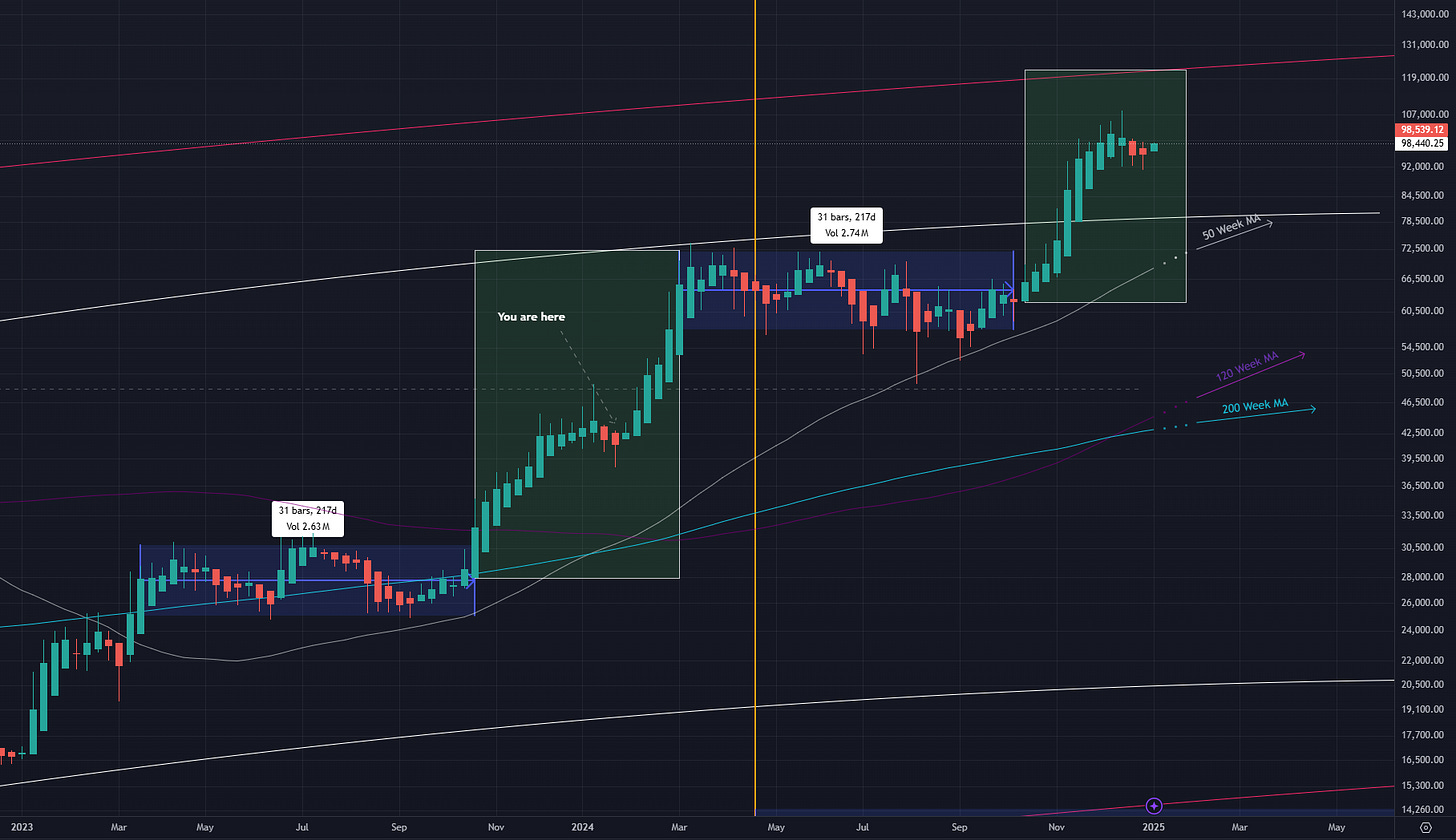
12/15 I posted the below setup on Trading View when the price was $103K, projecting a pullback into $91K and a rally between the end of the year and 1/10. Bitcoin got to $108K then pulled back to $91K and looks to be setting up for the next expansion in the window. Largely based on the fractal from 2023 but in the current context, it is based on a liquidity window and playing out quite well thus far.
Bitcoin Daily
Daily MACD, RSI, and OBV have all reset on the dip with plenty of room to fly.
Bitcoin LRC Chart
The fractal I have been pointing to for quite a while playing out is scary accurate - Last week I said if we get a green flip H.A. candle here I would expect $120K easy in the next 2 weeks and here we are (so far). That said, the downsides are really geopolitical rather than technical.



Great report. And the clown show graphic should go viral