


Debasement Hedges Ignite

Trad-Fi Market Summary
Hope everyone is enjoying the newsletter and had a chance to check out the
podcast, I made an appearance on their Thursday release, which we recorded a few weeks prior, but I think it held up against the TGA refill and other liquidity / macro news. Thank you so much for the support and kind words! (My favorite part was the still image they used for the thumbnail lmao!) For all the support, here is a free 30-day trial of the premium newsletter.U.S. and Significant Global Events (Week of July 14, 2025)
MONDAY, JULY 14
China Balance of Trade (June 2025)
Consensus Projection: Expected at ~$100 billion, indicating a robust trade surplus.
Notes: Released at 3:00 AM EDT. Reflects export and import trends amid ongoing global demand and supply chain issues, impacting CNY, commodities, and Asian markets.
China Exports YoY (June 2025)
Consensus Projection: Expected at ~5.5%, showing moderate growth.
Notes: Released at 3:00 AM EDT. Influences trade balances and economic recovery narratives, with potential effects on global supply chains.
China Imports YoY (June 2025)
Consensus Projection: Expected at ~2.5%, suggesting subdued domestic demand.
Notes: Released at 3:00 AM EDT. Provides insights into consumption and commodity needs, affecting CNY and related equities.
UK BRC Retail Sales Monitor YoY (June 2025)
Consensus Projection: Expected at ~0.4%, reflecting cautious consumer spending.
Notes: Released at 7:01 PM EDT (12:01 AM BST July 15). Gauges retail sector health, impacting GBP and BOE policy expectations.
TUESDAY, JULY 15
China GDP Growth Rate YoY (Q2 2025)
Consensus Projection: Expected at ~5.3%, indicating steady but moderated expansion.
Notes: Released at 10:00 PM EDT July 14 (10:00 AM CST July 15). A pivotal gauge of overall economic health, potentially prompting stimulus measures and affecting global markets and commodities.
China Industrial Production YoY (June 2025)
Consensus Projection: Expected at ~5.5%, suggesting stable manufacturing output.
Notes: Released at 10:00 PM EDT July 14 (10:00 AM CST July 15). Impacts views on industrial recovery, with implications for CNY and supply chains.
China Retail Sales YoY (June 2025)
Consensus Projection: Expected at ~6.1%, pointing to improving consumer activity.
Notes: Released at 10:00 PM EDT July 14 (10:00 AM CST July 15). Reflects domestic demand trends, influencing growth forecasts and equity sentiment.
Germany ZEW Economic Sentiment Index (July 2025)
Consensus Projection: Expected at ~49.1, showing optimistic outlook.
Notes: Released at 5:00 AM EDT (11:00 AM CET). Measures business confidence, impacting EUR and ECB policy considerations.
Eurozone ZEW Economic Sentiment Index (July 2025)
Consensus Projection: Expected at ~30, indicating moderate sentiment.
Notes: Released at 5:00 AM EDT (11:00 AM CET). Provides broader European economic expectations, affecting regional markets.
U.S. CPI (June 2025)
Consensus Projection: Expected at ~0.2% MoM / ~2.5% YoY, core CPI at ~0.2% MoM / ~2.9% YoY.
Notes: Released at 8:30 AM EDT. Critical inflation metric shaping Fed rate path and USD strength. Higher readings could dampen rate cut bets, lifting yields; downside surprises would bolster equities. (Truflation showing ~1.68%)
U.S. Empire State Manufacturing Index (July 2025)
Consensus Projection: Expected at ~-9.0, signaling ongoing contraction.
Notes: Released at 8:30 AM EDT. Offers early insight into manufacturing trends, influencing industrial stocks and broader economic views.
WEDNESDAY, JULY 16
U.S. PPI (June 2025)
Consensus Projection: Expected at ~0.2% MoM, indicating mild wholesale inflation.
Notes: Released at 8:30 AM EDT. Tracks producer prices, affecting corporate margins and Fed decisions. Upside surprises could pressure bonds; softer data supports rate cut hopes.
U.S. Industrial Production (June 2025)
Consensus Projection: Expected at ~0.1% MoM growth.
Notes: Released at 9:15 AM EDT. Measures output in key sectors, impacting GDP estimates and manufacturing sentiment.
U.S. Capacity Utilization (June 2025)
Consensus Projection: Expected at ~77.4%, reflecting underutilized resources.
Notes: Released at 9:15 AM EDT. Indicates economic slack, with implications for inflation and investment.
THURSDAY, JULY 17
U.S. Initial Jobless Claims (Week Ending July 12, 2025)
Consensus Projection: Expected at ~233,000, showing stable labor market.
Notes: Released at 8:30 AM EDT. Gauges layoffs and employment health, influencing Fed policy and USD.
U.S. Retail Sales (June 2025)
Consensus Projection: Expected at ~0.2% MoM, indicating modest consumer spending.
Notes: Released at 8:30 AM EDT. Key driver of GDP, affecting retail stocks and economic growth outlooks amid inflation pressures.
U.S. Import Price Index (June 2025)
Consensus Projection: Expected at ~0.3% MoM.
Notes: Released at 8:30 AM EDT. Reflects imported inflation, with ties to trade policies and USD value.
U.S. Philadelphia Fed Manufacturing Index (July 2025)
Consensus Projection: Expected at ~-0.3, near neutral territory.
Notes: Released at 8:30 AM EDT. Regional manufacturing gauge, impacting sector sentiment and equities.
FRIDAY, JULY 18
U.S. Housing Starts (June 2025)
Consensus Projection: Expected at ~1.30 million annualized rate.
Notes: Released at 8:30 AM EDT. Signals housing market vitality, influencing construction, mortgage rates, and consumer confidence.
Recap of Last Week’s Data Results (July 7–11, 2025)
U.S. Consumer Credit (May 2025)
Consensus Projection: Expected at ~$11.0 billion.
Result: Reported at $10.7 billion, slightly below consensus, highlighting cautious consumer borrowing amid elevated interest rates and tariff uncertainties. Financial stocks saw limited reaction.
China Caixin Services PMI (June 2025)
Consensus Projection: Expected at ~52.5.
Result: Reported at 52.8, modestly above expectations, indicating resilient service sector expansion despite trade headwinds. Asian markets gained mild support.
Germany Industrial Production (May 2025)
Consensus Projection: Expected at ~0.3% MoM growth.
Result: Reported at 0.4% MoM, beating estimates, bolstered by export recovery but tempered by energy costs. EUR strengthened modestly.
U.S. Wholesale Inventories (May 2025, Final)
Consensus Projection: Expected at ~0.2% MoM growth.
Result: Reported at 0.1% MoM, below consensus, suggesting inventory buildup amid softening demand. Industrial sectors faced minor pressure.
Japan Household Spending (May 2025)
Consensus Projection: Expected at ~0.5% YoY growth.
Result: Reported at 0.6% YoY, slightly above expectations, supporting domestic consumption views. JPY saw limited movement.
Trump’s RoW reciprocal tariff pause: was extended to August 1st, providing temporary relief to global trade tensions but maintaining uncertainty for markets.
U.S. CPI (June 2025)
Consensus Projection: Expected at ~3.1% YoY, core CPI at ~3.3% YoY.
Result: Reported at 3.0% YoY and core at 3.2% YoY, milder than anticipated, boosting rate cut optimism and lifting equities while pressuring USD.
China CPI (June 2025)
Consensus Projection: Expected at ~0.4% YoY.
Result: Reported at 0.3% YoY, below forecast, raising deflation risks and calls for stimulus. CNY weakened slightly.
U.S. PPI (June 2025)
Consensus Projection: Expected at ~2.6% YoY.
Result: Reported at 2.5% YoY, softer than expected, reinforcing disinflation trends, making Powell look a bit foolish again, and supporting bond rallies.
Global Equity Markets (Week Ending July 11, 2025)
Result: The S&P 500 and Nasdaq advanced toward new highs, buoyed by softer inflation data and the extension of the tariff pause, though volumes were light. Tech and consumer sectors led gains, while industrials lagged on lingering trade concerns. European and Asian indices rose modestly in sympathy.

Liquidity Summary (Fed liquidity guide)
Domestic liquidity was positive $202B WoW largely due to bank reserves and TGA rundown mechanics not catching up to OBBB passage until 7/15, as outlined in the Macro Timeline.

Reverse Repo Market (RRP):
The RRP is down from a high of $461B 6/30 to $181B to close the week and is likely to run down to near-zero over the next few weeks as the TGA rebuilds.
Treasury General Account (TGA):
As mentioned last week, the TGA would continue to run down until about 7/15 until the Treasury auctions start to catch up to fill the balance to $530B in July and $850B+ through September.
Based on the latest data from the Federal Reserve’s H.4.1, bank reserves are expected to decline by $200-400 billion relatively quickly. This could resume the downward trend observed in recent weeks, despite a temporary rebound. The H.4.1 report shows reserve balances with Federal Reserve Banks at $3,330,249 million (or $3.33 trillion) for the week ending July 9, up $104,269 million from the prior week. With the anticipated reserve drop, levels are projected to fall below the $3 trillion mark, which represents approximately 10% of U.S. GDP and is considered a key constraint level. All eyes will be on this threshold as the TGA refill progresses.
Fed Balance Sheet (QE/QT):
The Federal Reserve's quantitative tightening (QT) continues, with the balance sheet at about $6.71 trillion as of July 9, 2025, down $1.6 billion weekly and $561 billion year-over-year. Key drivers like Treasury General Account (TGA) rebuild, falling bank reserves, and tightening swap spreads are likely to accelerate QT's end. The TGA rebuild post-debt ceiling is draining liquidity, with balances at $320 billion (down $40 billion weekly) but expected to pull over $400 billion more in July, depleting reserves and potentially spiking repo rates. Swap spreads have tightened negatively (10-year at -44 bps, 30-year at -78 bps), reflecting slight Treasury market stress and balance sheet constraints, which could prompt an earlier QT halt.
Prior to the March 19, 2025 announcement (effective April 1, 2025), the cap was up to $60 billion per month ($25 billion for Treasuries + $35 billion for MBS). After the reduction, the cap is up to $40 billion per month ($5 billion for Treasuries + $35 billion for MBS). Actual monthly reductions can vary below these caps based on maturities and other factors, as seen in the provided data averaging ~55 billion before April 2025 and ~26 billion afterward.
The Fed's earlier slowdown of runoff to $60 billion monthly (from $95 billion) has prepared for this, reducing disruption risks. Supportive measures like potential SLR adjustments (excluding Treasuries from leverage ratios) and Treasury debt management will ease the transition, allowing a smoother QT exit amid economic uncertainties. Watch FOMC minutes and TGA flows for signals.
For a complete view of global liquidity, projections, and how we are positioning, see the Macro Timeline Update and join the chat for premium members.
Federal Reserve & Co.
The past week saw several notable releases from the Federal Reserve, focusing on monetary policy insights, economic conditions, and official commentary. Below is a concise summary of the main elements:
FOMC Meeting Minutes (Released July 9)
The minutes from the June 17-18, 2025, FOMC meeting revealed a unanimous vote to keep the federal funds rate target range at 4.25%-4.5%.
Officials characterized the policy stance as "moderately or modestly restrictive," deeming it suitable amid solid economic expansion and a strong labor market.
Economic growth was robust, with real GDP advancing at a strong clip in Q2 2025, though most participants expected a slowdown ahead due to heightened uncertainties from trade policies and geopolitical factors.
Inflation progress toward the 2% target remained uneven: total PCE inflation stood at 2.3% and core at 2.6% in May 2025.
Tariffs were highlighted as a potential upward pressure on inflation, possibly increasing persistence, but impacts might be delayed or offset by supply chain shifts.
Overall risks to inflation were tilted to the upside, with projections anticipating a return to 2% by 2027.
Speeches by Fed Officials & Multiple Fed officials delivered remarks, providing further context on policy and economic outlook. Notable examples include:
Governor Christopher J. Waller (July 10): In a speech titled "Demystifying the Federal Reserve's Balance Sheet" at the Federal Reserve Bank of Dallas, Waller discussed the evolution and management of the Fed's balance sheet. Key takeaways:
The balance sheet has expanded significantly since 2007 due to QE measures and the shift to an ample-reserves framework for liquidity.
Liabilities include non-interest-bearing currency and interest-bearing reserves; assets should ideally match to minimize risks.
Current holdings have maturity mismatches from QE, leading to interest rate risks; gradual adjustments toward shorter-duration securities are recommended to reduce size while maintaining stability.
St. Louis Fed President Alberto Musalem (July 10): Participated in a live conversation with the Official Monetary and Financial Institutions Forum (OMFIF), covering monetary policy and financial stability topics (specific takeaways not detailed in available summaries).
Let’s not be silly, though.. below the green line will be Trump’s Fed, and rates will be MUCH lower than 3.50%

USD VS Everyone Else
Dollar Index (DXY): closed at $97.9 on July 11, 2025, up approximately 0.88% from 96.991 the prior week, snapping a streak of weekly declines as expected and announced here, amid stronger-than-expected U.S. jobs data that tempered Federal Reserve rate cut expectations. The index rebounded from recent lows below 97.0, supported by resilient economic indicators and ongoing U.S. trade policy developments, though persistent tariff uncertainties and shifts toward higher-yielding assets continue to cap upside potential.
U.S. Economic Data: June’s employment report, released July 3, showed stronger-than-expected job growth, defying forecasts of a slowdown and eliminating market expectations for a July Federal Reserve rate cut. The data closed the door on near-term easing, with traders now anticipating just two rate cuts by year-end, implying around 50bps of easing for 2025 and a reduced probability—around 50%—of a cut by September. Core PCE data from late June met expectations at 0.2% month-on-month and 2.6% year-on-year, while personal income aligned with estimates, though real consumption softened. The Atlanta Fed’s GDPNow Q2 estimate held at 2.6% as of July 9, down slightly from earlier projections amid mixed indicators.
U.S. Trade: The deficit persists at around 4.2% of GDP, posing ongoing pressure on Dollar strength. President Trump announced a trade deal with Vietnam, imposing a 20% tariff plus additional measures for freight transshipping from China, while indicating no deal with Japan and setting tariffs at 25%. A truce with China slashed tariffs to 10%, providing more negotiation time. The global tariff pause ended July 9, with letters sent to over 20 countries starting July 7, outlining unilateral tariffs effective August 1 ranging from 20% to 50%, including 25% on Japan, South Korea, Brunei, Malaysia, Kazakhstan, Moldova, and Tunisia; 30% on Algeria, Bosnia and Herzegovina, Iraq, Libya, Mexico, South Africa, Sri Lanka, and the European Union; 35% on Bangladesh, Serbia, and Canada; 36% on Cambodia and Thailand; 40% on Laos and Myanmar; 50% on Brazil, as well as commodities like copper, steel, and aluminum; 20% on the Philippines; 32% on Indonesia; and adjustments for automobiles at 25%. These new reciprocal rates reflect differences from the April 2 announced levels, with notable increases such as +40% for Brazil and copper, +25% for steel and aluminum, +22.5% for automobiles, +15% for Canada, and +10% for Mexico and the EU, alongside reductions like -16% for Sri Lanka, -13% for Cambodia, -6% for Laos and Moldova, and -5% for Bosnia and Herzegovina. U.S. Treasury Secretary Scott Bessent confirmed these align with prior threats if no deals are reached, though some deadlines were pushed.
CNY/USD: The Yuan remained stable, with USD/CNY at 7.1699 as of July 11, up slightly week-on-week. Recent Caixin PMI data for June indicated steady expansion, though export growth moderated under U.S. sanctions. The PBOC maintained Yuan stability, with tighter offshore liquidity controls in Q3 guidance.
JPY/USD: The Yen weakened, with USD/JPY at 171.81 as of July 11, up from recent levels. Japan's June retail sales are expected to rise after a May drop, with industrial output steadying, though BoJ rate hike speculation has eased. Support lies around 170.00, resistance at 173.00, with 30-year JGB yields up year-to-date.
EUR/USD: The Euro softened, with EUR/USD at 1.1683 as of July 11, down from 1.1760. Movements were influenced by stable Eurozone PMI at 50.2 in June and inflation hitting the ECB's 2% target, though ECB policy signals limited gains. Support is at 1.1650, resistance at 1.1750. A DXY push above 98.0 could pressure EUR/USD further.
Emerging Markets (EMFX): EM currencies showed resilience amid subsiding volatility and tariff developments, with carry trades gaining traction. The Mexican Peso (MXN) traded at USD/MXN 18.6326, the Indonesian Rupiah (IDR) held firm on Asian demand, while the Brazilian Real (BRL) was at 5.5585 amid fiscal worries. The Turkish Lira (TRY) faced pressures from high inflation, nearing 39.808. The South African Rand (ZAR) stood at 17.747, bolstered by commodity stability. Analysts note Asian EMFX strength but highlight risks from U.S. policy shifts.
Bitcoin Summary
Bitcoin has entered price discovery after a price surge from approximately $103,000 to $123,000 over just a few days. This resulted in over $1.01 billion in cryptocurrency short positions being liquidated across the market in the same timeframe, marking one of the largest bear extinction events of 2025.

So, how much does this Bitcoin rally have left in the tank?
Puelle Multiple: Based on the Puell Multiple, Bitcoin appears to have considerable room to appreciate before reaching overheated levels. At 1.55, the metric is far from the 4-5 threshold that has historically preceded corrections. Assuming a rapid price increase (common in bull phases, where the 365-day average lags), Bitcoin's price could potentially rise by a factor of 2.5-3x (from ~$108,000 to $270,000-$324,000) to push the Puell Multiple into the 4-5 range. This rough calculation accounts for the direct proportionality between price and daily issuance value—doubling the price roughly doubles the Puell if the rise is swift, though slower gains would allow the spike to be less pronounced as the moving average catches up.
MVRV Z-Score: With the MVRV Z-Score at 2.8—far below the 7+ threshold that has historically preceded major corrections—Bitcoin has substantial room for appreciation before entering overheated territory. Assuming a swift price rally (where realized cap lags due to limited coin movement), the metric could reach 7 with a roughly 2-2.5x increase in Bitcoin's price, potentially pushing it from ~$110,000 to $220,000-$275,000. This estimate derives from the linear relationship between price and the Z-Score in short-term surges: the current deviation (market cap minus realized cap) would need to expand by a factor of about 2.5 (7 / 2.8) to hit the red zone, adjusted for minimal immediate changes in realized cap.
This does not mean it is time to FOMO in, but there is room in the tank to run in this “cycle” and that volatility is the only thing guaranteed over H2-2025.
Bitcoin Daily
Not much to say this week other than clout chasing after calling for a July breakout during the entire consolidation. $130K is a legit target over the long term but would not recommend chasing if you missed it as a back-test of the breakout is likely to punish late longs at some point. Other than, hope you got in positions and are enjoying the ride!
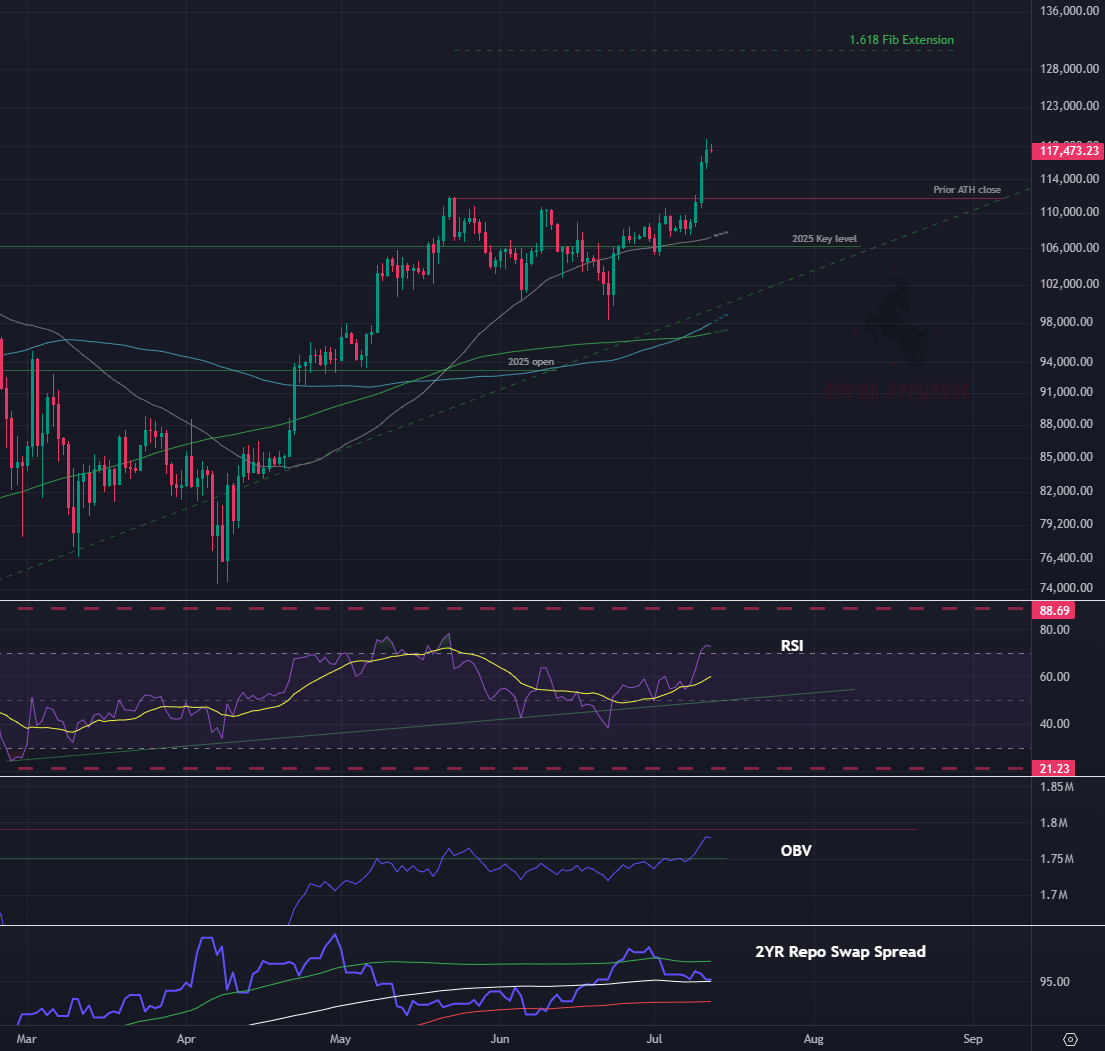
Bitcoin LRC Chart
The LRC chart does it again. Two weeks ago, Bitcoin H.A. candles got the green flip after consolidation at $103,000 and rallied 13% to $119,000

Can you please give an explanation of the LRC chart and how you use it?